Animations
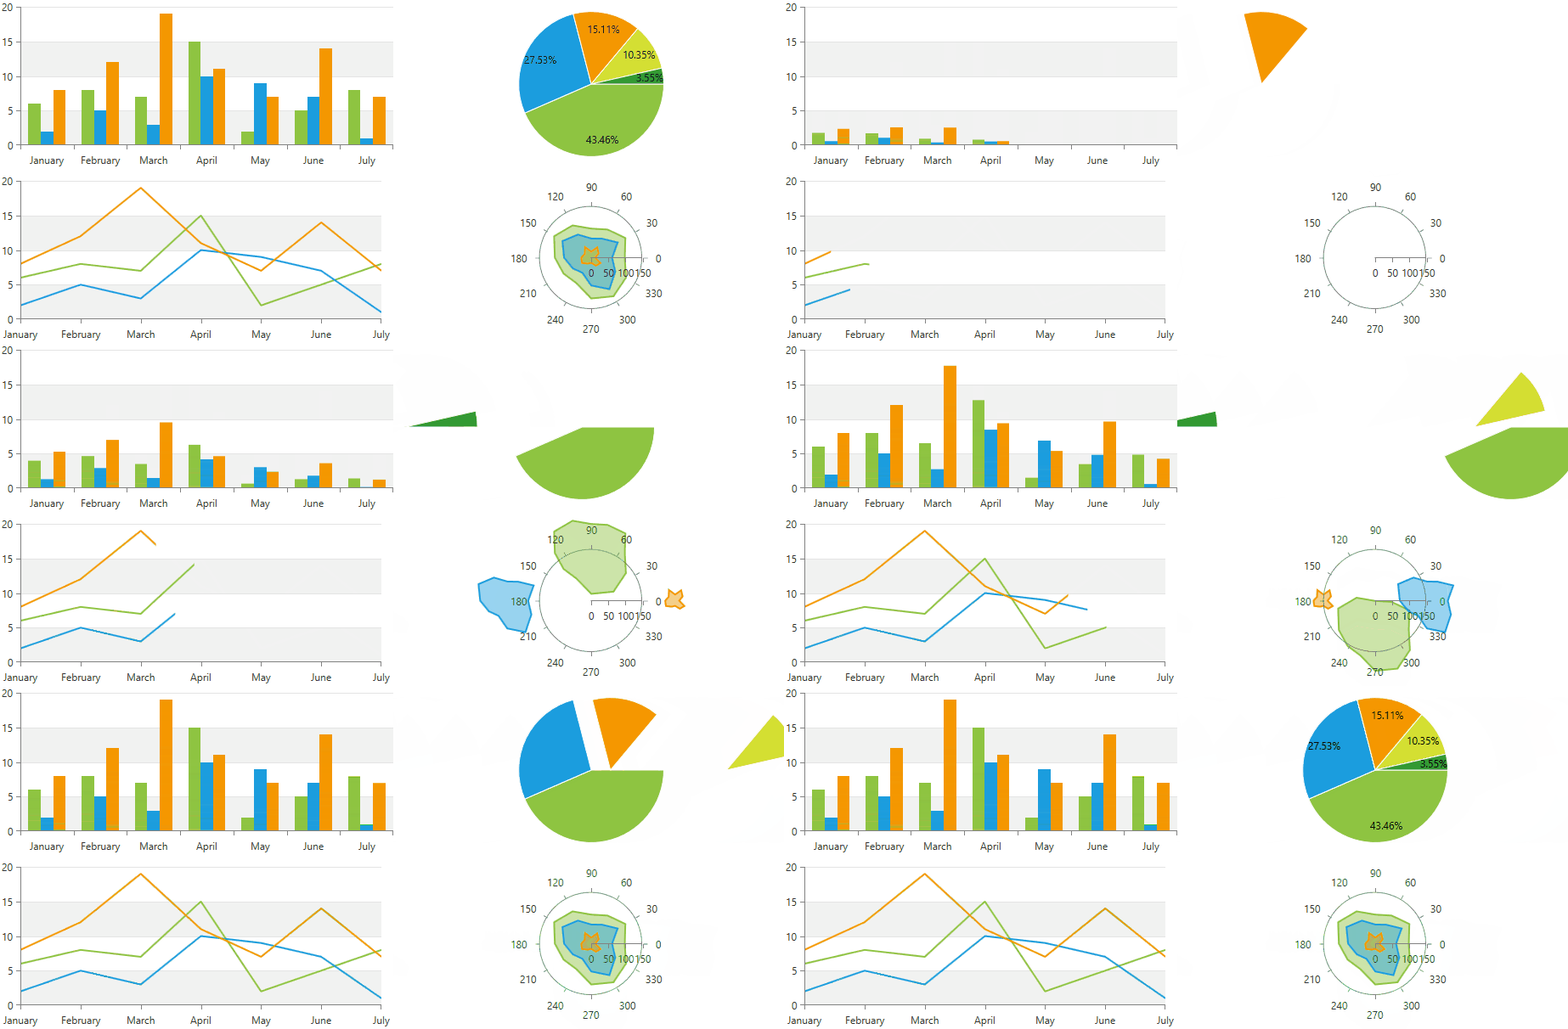
With the R2 2018 version of our controls, you can now animate RadChartView series and their points. The series and the points can be animated using either built-in or custom animation effects. To animate the series or the points first you need to set the SeriesAnimation and/or PointAnimation property with your animation. Depending on which element you want to animate (Series,Points or Both) you can call the PlaySeriesAnimation() and PlayPointAnimations() methods.
Figure 1: Chart Animations
Animation Types
There are several different built-in animations which can be used to animate the chart series and their points. Each animation allows you to apply duration, delay and an easing function to its animated effect. The easing functions make the animation much more realistic and smoother. There is a set of predefined easing functions in WPF and you are allowed to create custom ones, too.
To learn more about the easing functions you can take a look at this MSDN help article.
Animation Base Class
The build-in animations of the chart derives from the ChartAnimationBase base class. All animation expose the following properties which can be used to further customize their effect.
- Delay: A property of type TimeSpan that gets or sets the delay of the chart animation instance.
- Duration: A property of type TimeSpan that gets or sets the duration of the chart animation instance.
- Easing: A property of type IEasingFunction that gets or sets the easing function used in this chart animation instance.
Move Animation
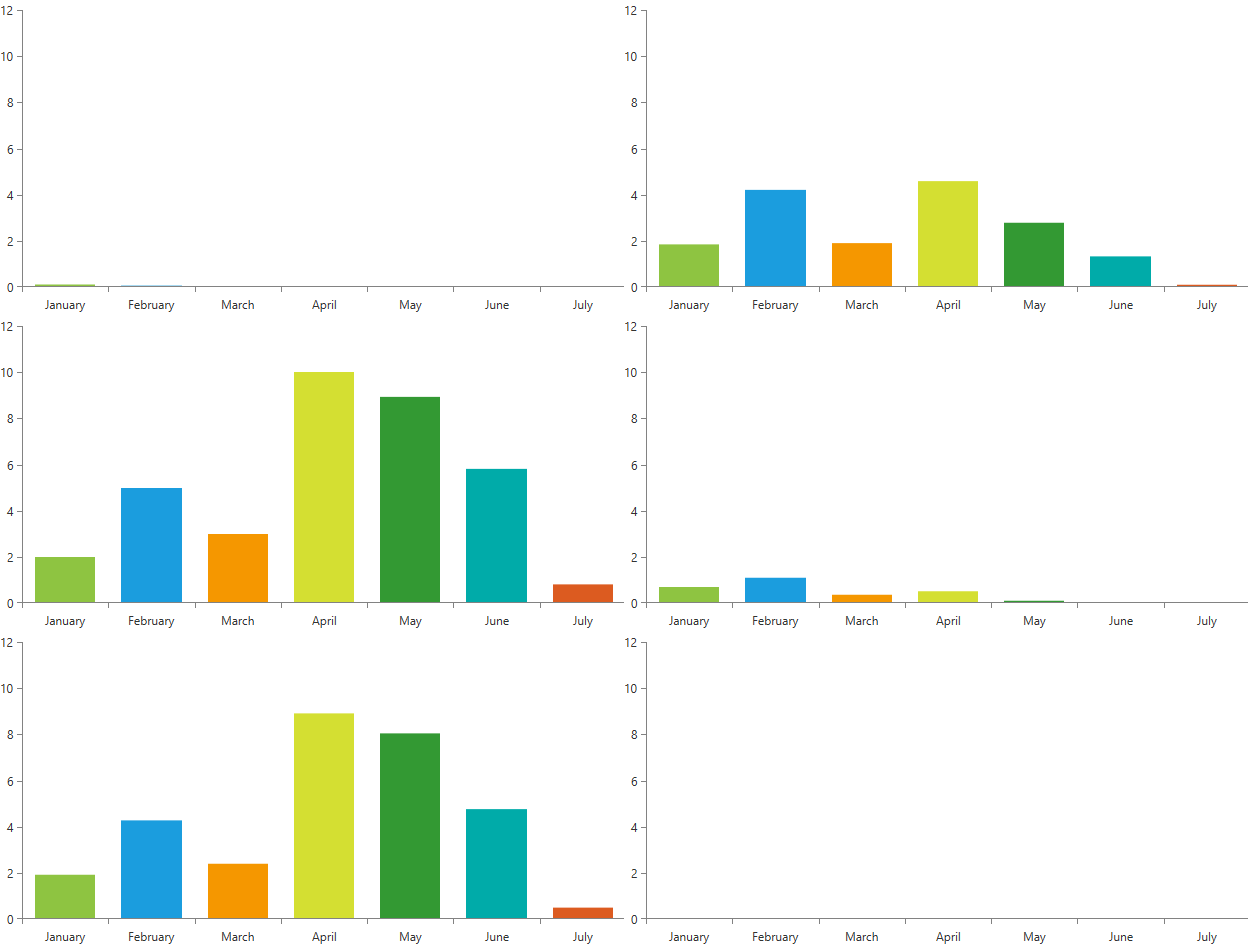
The ChartMoveAnimation animates the sliding effect of the series/point from the four sides of the plot area to their places on the plot area. To modify the animation you can use the following properties:
-
MoveAnimationType: A property of type MoveAnimationType that gets or sets from which side of the chart plot area the elements animation starts. The move animation type property is an enumeration and it allows the following values:
- Left: Default value. When set the series or points are moved starting from the left side of the plot area.
- Top: When set series or points are moved starting from the top side of the plot area.
- Right: When set series or points are moved starting from the right side of the plot area.
- Bottom: When set series or points are moved starting from the left side of the plot area.
Example 1: Setting move animation in XAML
<telerik:RadCartesianChart Palette="Windows8">
    <telerik:RadCartesianChart.HorizontalAxis>
        <telerik:CategoricalAxis/>
    </telerik:RadCartesianChart.HorizontalAxis>
    <telerik:RadCartesianChart.VerticalAxis>
        <telerik:LinearAxis />
    </telerik:RadCartesianChart.VerticalAxis>
    <telerik:RadCartesianChart.Series>
        <telerik:BarSeries PaletteMode="DataPoint">
            <telerik:BarSeries.DataPoints>
                <telerik:CategoricalDataPoint Category="January" Value="2" />
                <telerik:CategoricalDataPoint Category="February" Value="5" />
                <telerik:CategoricalDataPoint Category="March" Value="3" />
                <telerik:CategoricalDataPoint Category="April" Value="10" />
                <telerik:CategoricalDataPoint Category="May" Value="9" />
                <telerik:CategoricalDataPoint Category="June" Value="7" />
                <telerik:CategoricalDataPoint Category="July" Value="1" />
            </telerik:BarSeries.DataPoints>
            <telerik:BarSeries.PointAnimation>
                <telerik:ChartMoveAnimation Delay="0:0:0.125" Duration="0:0:1.55" MoveAnimationType="Top" >
                    <telerik:ChartMoveAnimation.Easing>
                        <BounceEase EasingMode="EaseOut" Bounces="20" Bounciness="5" />
                    </telerik:ChartMoveAnimation.Easing>
                </telerik:ChartMoveAnimation>
            </telerik:BarSeries.PointAnimation>
        </telerik:BarSeries>
    </telerik:RadCartesianChart.Series>
</telerik:RadCartesianChart>
Figure 2: This animation look as follows
Reveal Animation
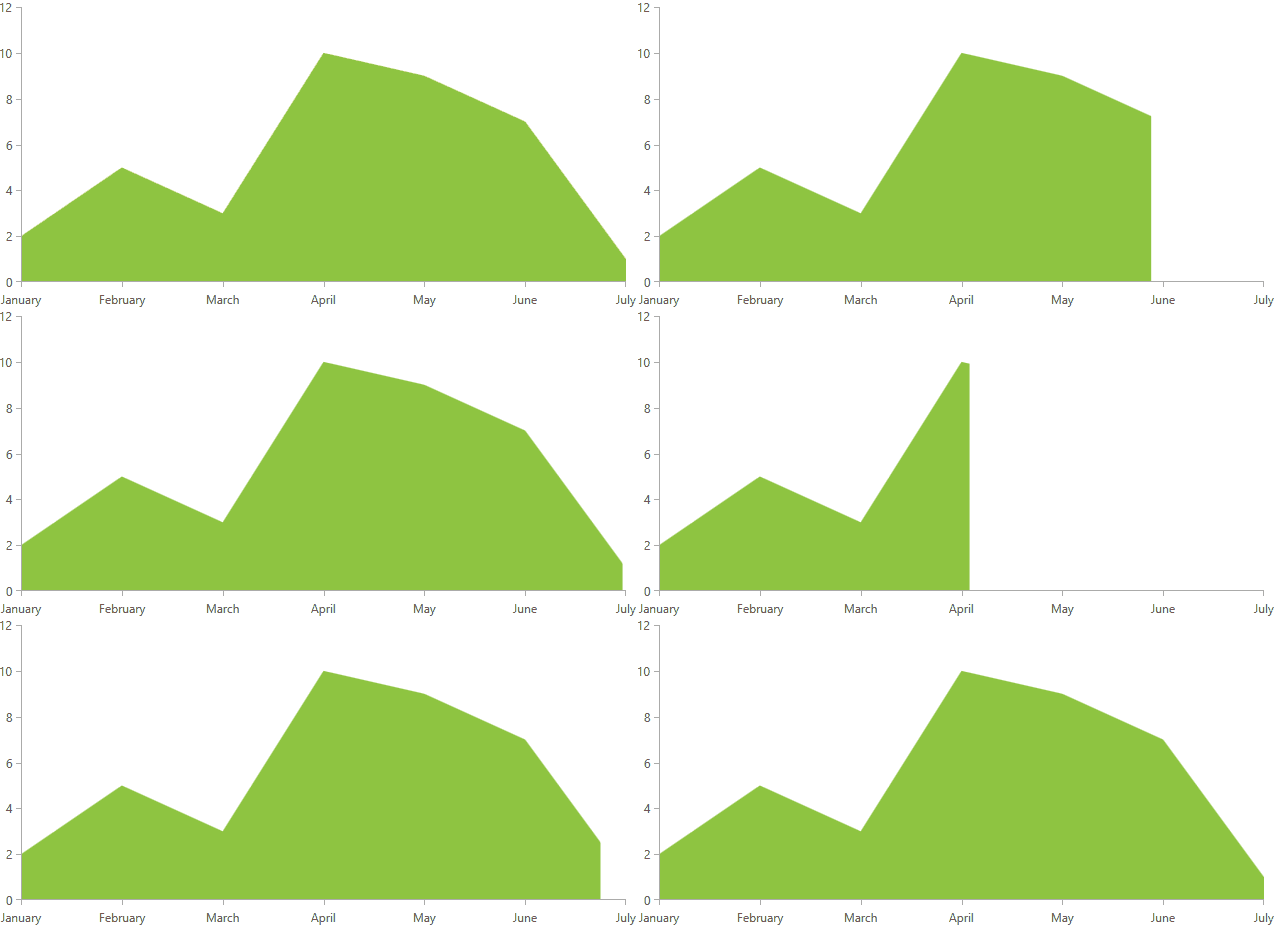
The ChartRevealAnimation animation animates the clipping of the series and their points. The revealing can be horizontally or vertically.
-
AnimationDirection: A property of type AnimationDirection that gets or sets the direction of the animation. The animation direction property is an enumeration and it allows the following values:
- In: Default value. When set the animation animates an element that appears.
- Out: When set the animation animates an element that disappears.
-
Orientation: A property of type Orientation that gets or sets the orientation of the animation. The orientation property is an enumeration and it allows the following values:
- Horizontal: Default value. When set the animation is horizontally oriented.
- Vertical: When set the animation is vertically oriented.
Example 2: Setting reveal animation in XAML
<telerik:RadCartesianChart Palette="Windows8">
    <telerik:RadCartesianChart.HorizontalAxis>
        <telerik:CategoricalAxis/>
    </telerik:RadCartesianChart.HorizontalAxis>
    <telerik:RadCartesianChart.VerticalAxis>
        <telerik:LinearAxis />
    </telerik:RadCartesianChart.VerticalAxis>
    <telerik:RadCartesianChart.Series>
        <telerik:AreaSeries>
            <telerik:AreaSeries.DataPoints>
                <telerik:CategoricalDataPoint Category="January" Value="2" />
                <telerik:CategoricalDataPoint Category="February" Value="5" />
                <telerik:CategoricalDataPoint Category="March" Value="3" />
                <telerik:CategoricalDataPoint Category="April" Value="10" />
                <telerik:CategoricalDataPoint Category="May" Value="9" />
                <telerik:CategoricalDataPoint Category="June" Value="7" />
                <telerik:CategoricalDataPoint Category="July" Value="1" />
            </telerik:AreaSeries.DataPoints>
            <telerik:AreaSeries.SeriesAnimation>
                <telerik:ChartRevealAnimation AnimationDirection="In" Orientation="Horizontal" >
                    <telerik:ChartRevealAnimation.Easing>
                        <QuarticEase EasingMode="EaseOut"/>
                    </telerik:ChartRevealAnimation.Easing>
                </telerik:ChartRevealAnimation>
            </telerik:AreaSeries.SeriesAnimation>
        </telerik:AreaSeries>
    </telerik:RadCartesianChart.Series>
</telerik:RadCartesianChart>
Figure 3: This animation look as follows
Fade Animation
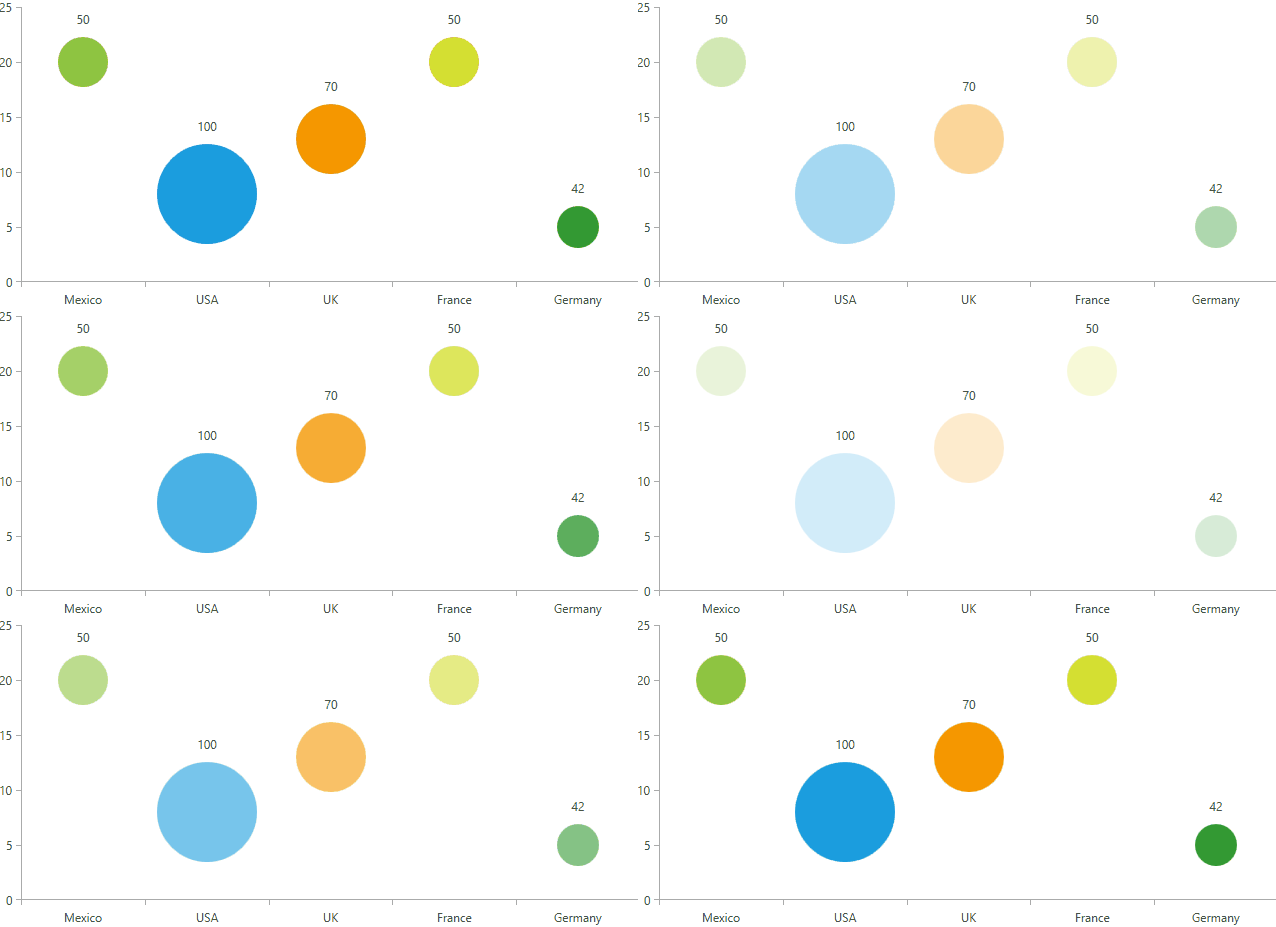
The ChartFadeAnimation fades in the series and their points. The fade effect can be additionally modified by specifying the fade range using the MinOpacity and MaxOpacity properties.
- MinOpacity: A property of type double that gets or sets the initial opacity of the animation. Default value is 0.01
- MaxOpacity: A property of type double that gets or sets the final opacity of the animation. Default value is 1.
Example 3: Setting fade animation in XAML
<telerik:RadCartesianChart Palette="Windows8">
    <telerik:RadCartesianChart.HorizontalAxis>
        <telerik:CategoricalAxis />
    </telerik:RadCartesianChart.HorizontalAxis>
    <telerik:RadCartesianChart.VerticalAxis>
        <telerik:LinearAxis />
    </telerik:RadCartesianChart.VerticalAxis>
    <telerik:RadCartesianChart.Series>
        <telerik:BubbleSeries ShowLabels="True" PaletteMode="DataPoint">
            <telerik:BubbleSeries.DataPoints>
                <telerik:BubbleDataPoint BubbleSize="50" Category="Mexico" Value="20" />
                <telerik:BubbleDataPoint BubbleSize="100" Category="USA" Value="8" />
                <telerik:BubbleDataPoint BubbleSize="70" Category="UK" Value="13" />
                <telerik:BubbleDataPoint BubbleSize="50" Category="France" Value="20" />
                <telerik:BubbleDataPoint BubbleSize="42" Category="Germany" Value="5" />
            </telerik:BubbleSeries.DataPoints>
            <telerik:BubbleSeries.PointAnimation>
                <telerik:ChartFadeAnimation/>
            </telerik:BubbleSeries.PointAnimation>
        </telerik:BubbleSeries>
    </telerik:RadCartesianChart.Series>
</telerik:RadCartesianChart>
Figure 4: This animation look as follows
Drop and Fade Animation
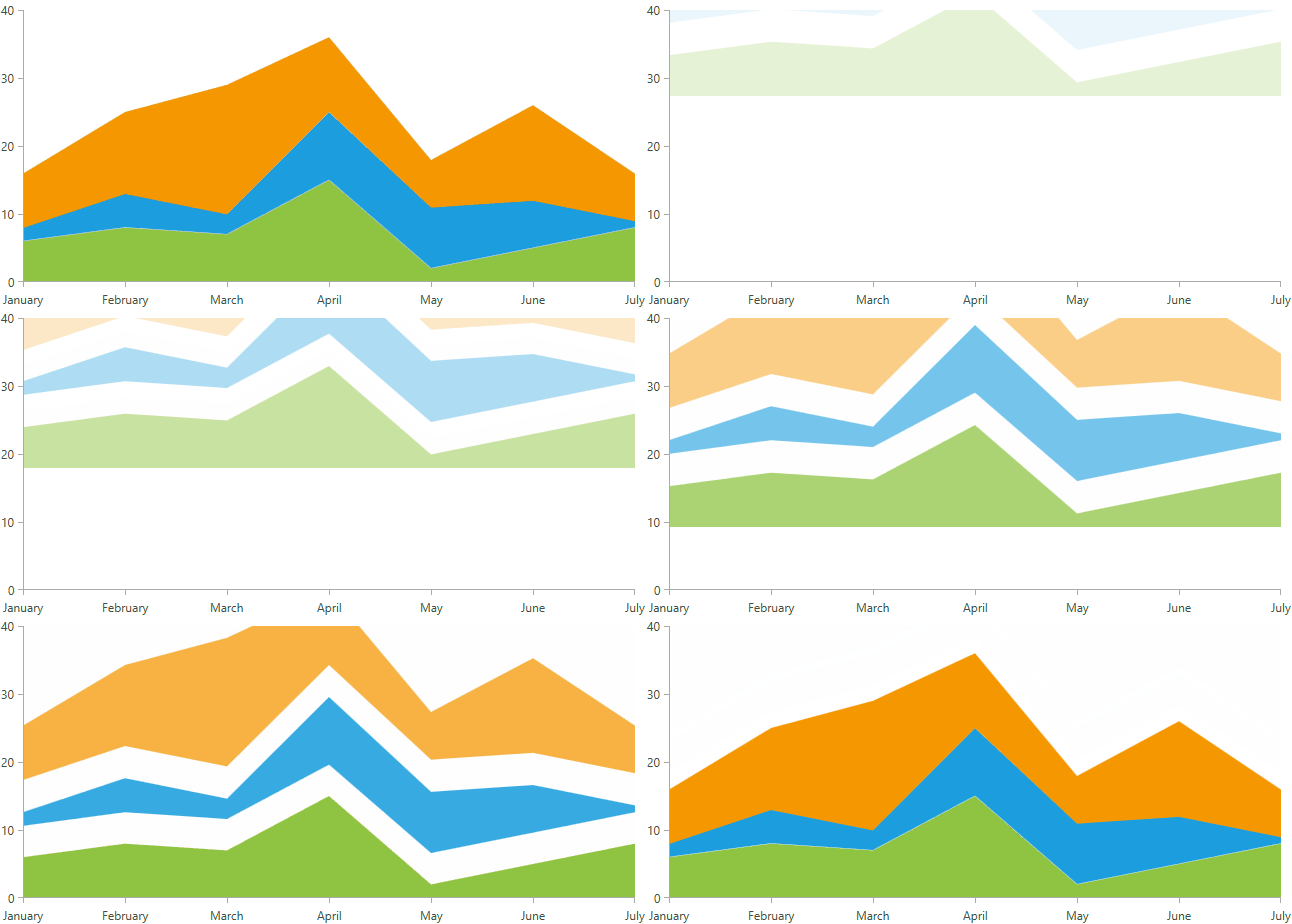
The ChartDropFadeAnimation derives from ChartMoveAnimation. The difference here is that this animation add additional fade in effect.
Example 4: Setting drop and fade animation in XAML
<telerik:RadCartesianChart x:Name="chart" Palette="Windows8">
    <telerik:RadCartesianChart.HorizontalAxis>
        <telerik:CategoricalAxis />
    </telerik:RadCartesianChart.HorizontalAxis>
    <telerik:RadCartesianChart.VerticalAxis>
        <telerik:LinearAxis />
    </telerik:RadCartesianChart.VerticalAxis>
    <telerik:RadCartesianChart.Series>
        <telerik:AreaSeries CombineMode="Stack">
            <telerik:AreaSeries.DataPoints>
                <telerik:CategoricalDataPoint Category="January" Value="6" />
                <telerik:CategoricalDataPoint Category="February" Value="8" />
                <telerik:CategoricalDataPoint Category="March" Value="7" />
                <telerik:CategoricalDataPoint Category="April" Value="15" />
                <telerik:CategoricalDataPoint Category="May" Value="2" />
                <telerik:CategoricalDataPoint Category="June" Value="5" />
                <telerik:CategoricalDataPoint Category="July" Value="8" />
            </telerik:AreaSeries.DataPoints>
            <telerik:AreaSeries.SeriesAnimation>
                <telerik:ChartDropFadeAnimation MoveAnimationType="Top" Duration="0:0:1.500" Delay="0:0:0.200"/>
            </telerik:AreaSeries.SeriesAnimation>
        </telerik:AreaSeries>
        <telerik:AreaSeries CombineMode="Stack">
            <telerik:AreaSeries.DataPoints>
                <telerik:CategoricalDataPoint Category="January" Value="2" />
                <telerik:CategoricalDataPoint Category="February" Value="5" />
                <telerik:CategoricalDataPoint Category="March" Value="3" />
                <telerik:CategoricalDataPoint Category="April" Value="10" />
                <telerik:CategoricalDataPoint Category="May" Value="9" />
                <telerik:CategoricalDataPoint Category="June" Value="7" />
                <telerik:CategoricalDataPoint Category="July" Value="1" />
            </telerik:AreaSeries.DataPoints>
            <telerik:AreaSeries.SeriesAnimation>
                <telerik:ChartDropFadeAnimation MoveAnimationType="Top" Duration="0:0:1.500" Delay="0:0:0.200"/>
            </telerik:AreaSeries.SeriesAnimation>
        </telerik:AreaSeries>
        <telerik:AreaSeries CombineMode="Stack">
            <telerik:AreaSeries.DataPoints>
                <telerik:CategoricalDataPoint Category="January" Value="8" />
                <telerik:CategoricalDataPoint Category="February" Value="12" />
                <telerik:CategoricalDataPoint Category="March" Value="19" />
                <telerik:CategoricalDataPoint Category="April" Value="11" />
                <telerik:CategoricalDataPoint Category="May" Value="7" />
                <telerik:CategoricalDataPoint Category="June" Value="14" />
                <telerik:CategoricalDataPoint Category="July" Value="7" />
            </telerik:AreaSeries.DataPoints>
            <telerik:AreaSeries.SeriesAnimation>
                <telerik:ChartDropFadeAnimation MoveAnimationType="Top" Duration="0:0:1.500" Delay="0:0:0.200" />
            </telerik:AreaSeries.SeriesAnimation>
        </telerik:AreaSeries>
    </telerik:RadCartesianChart.Series>
</telerik:RadCartesianChart>
Figure 5: This animation look as follows
Scale Animation
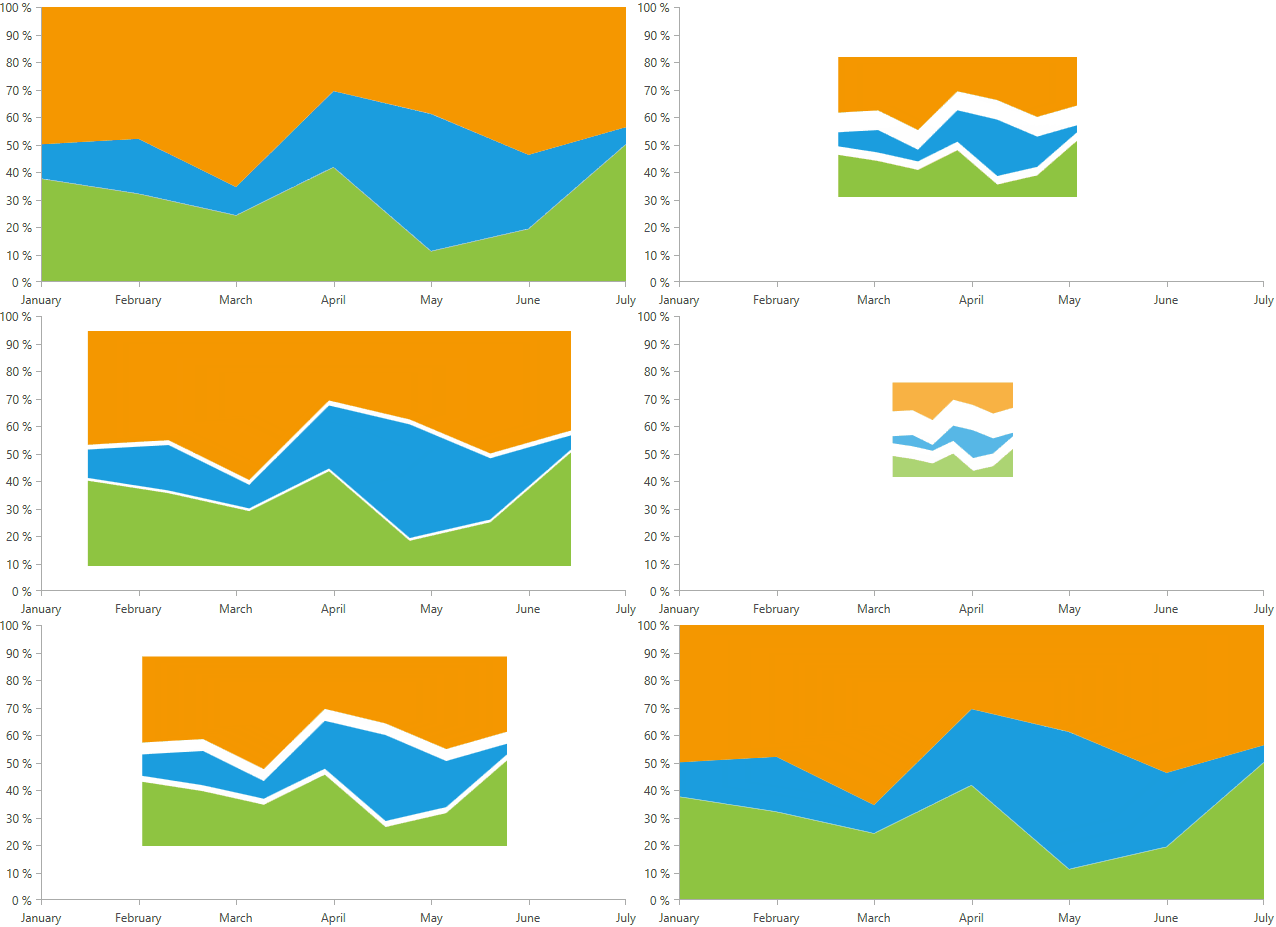
The ChartScaleAnimation animates the size of the series and their points. You can customize this animation by setting the starting point of the animation and the scale mode.
- MinScale: A property of type double that gets or sets the initial scale of the animation.
- MaxScale: A property of type double that gets or sets the final scale of the animation.
- RenderTransformOrigin: A property of type Point that gets or sets the starting point of the scaling. Default value is Point(0.5,0.5).
-
ScaleMode: A property of type ScaleMode that gets or sets the orientation of the animation. The scale mode property is an enumeration and it allows the following values:
- Horizontal: Default value. When set the scaling is performed horizontally.
- Vertical: When set the scaling is performed vertically.
- Both: When set the scaling is performed in both directions.
Example 5: Setting scale animation in XAML
<telerik:RadCartesianChart x:Name="chart" Palette="Windows8">
    <telerik:RadCartesianChart.HorizontalAxis>
        <telerik:CategoricalAxis />
    </telerik:RadCartesianChart.HorizontalAxis>
    <telerik:RadCartesianChart.VerticalAxis>
        <telerik:LinearAxis />
    </telerik:RadCartesianChart.VerticalAxis>
    <telerik:RadCartesianChart.Series>
        <telerik:AreaSeries CombineMode="Stack100">
            <telerik:AreaSeries.DataPoints>
                <telerik:CategoricalDataPoint Category="January" Value="6" />
                <telerik:CategoricalDataPoint Category="February" Value="8" />
                <telerik:CategoricalDataPoint Category="March" Value="7" />
                <telerik:CategoricalDataPoint Category="April" Value="15" />
                <telerik:CategoricalDataPoint Category="May" Value="2" />
                <telerik:CategoricalDataPoint Category="June" Value="5" />
                <telerik:CategoricalDataPoint Category="July" Value="8" />
            </telerik:AreaSeries.DataPoints>
            <telerik:AreaSeries.SeriesAnimation>
                <telerik:ChartScaleAnimation ScaleMode="Both" />
            </telerik:AreaSeries.SeriesAnimation>
        </telerik:AreaSeries>
        <telerik:AreaSeries CombineMode="Stack100">
            <telerik:AreaSeries.DataPoints>
                <telerik:CategoricalDataPoint Category="January" Value="2" />
                <telerik:CategoricalDataPoint Category="February" Value="5" />
                <telerik:CategoricalDataPoint Category="March" Value="3" />
                <telerik:CategoricalDataPoint Category="April" Value="10" />
                <telerik:CategoricalDataPoint Category="May" Value="9" />
                <telerik:CategoricalDataPoint Category="June" Value="7" />
                <telerik:CategoricalDataPoint Category="July" Value="1" />
            </telerik:AreaSeries.DataPoints>
            <telerik:AreaSeries.SeriesAnimation>
                <telerik:ChartScaleAnimation ScaleMode="Both" />
            </telerik:AreaSeries.SeriesAnimation>
        </telerik:AreaSeries>
        <telerik:AreaSeries CombineMode="Stack100">
            <telerik:AreaSeries.DataPoints>
                <telerik:CategoricalDataPoint Category="January" Value="8" />
                <telerik:CategoricalDataPoint Category="February" Value="12" />
                <telerik:CategoricalDataPoint Category="March" Value="19" />
                <telerik:CategoricalDataPoint Category="April" Value="11" />
                <telerik:CategoricalDataPoint Category="May" Value="7" />
                <telerik:CategoricalDataPoint Category="June" Value="14" />
                <telerik:CategoricalDataPoint Category="July" Value="7" />
            </telerik:AreaSeries.DataPoints>
            <telerik:AreaSeries.SeriesAnimation>
                <telerik:ChartScaleAnimation ScaleMode="Both" />
            </telerik:AreaSeries.SeriesAnimation>
        </telerik:AreaSeries>
    </telerik:RadCartesianChart.Series>
</telerik:RadCartesianChart>
Figure 6: This animation look as follows
Pie Chart Angle Range Animation
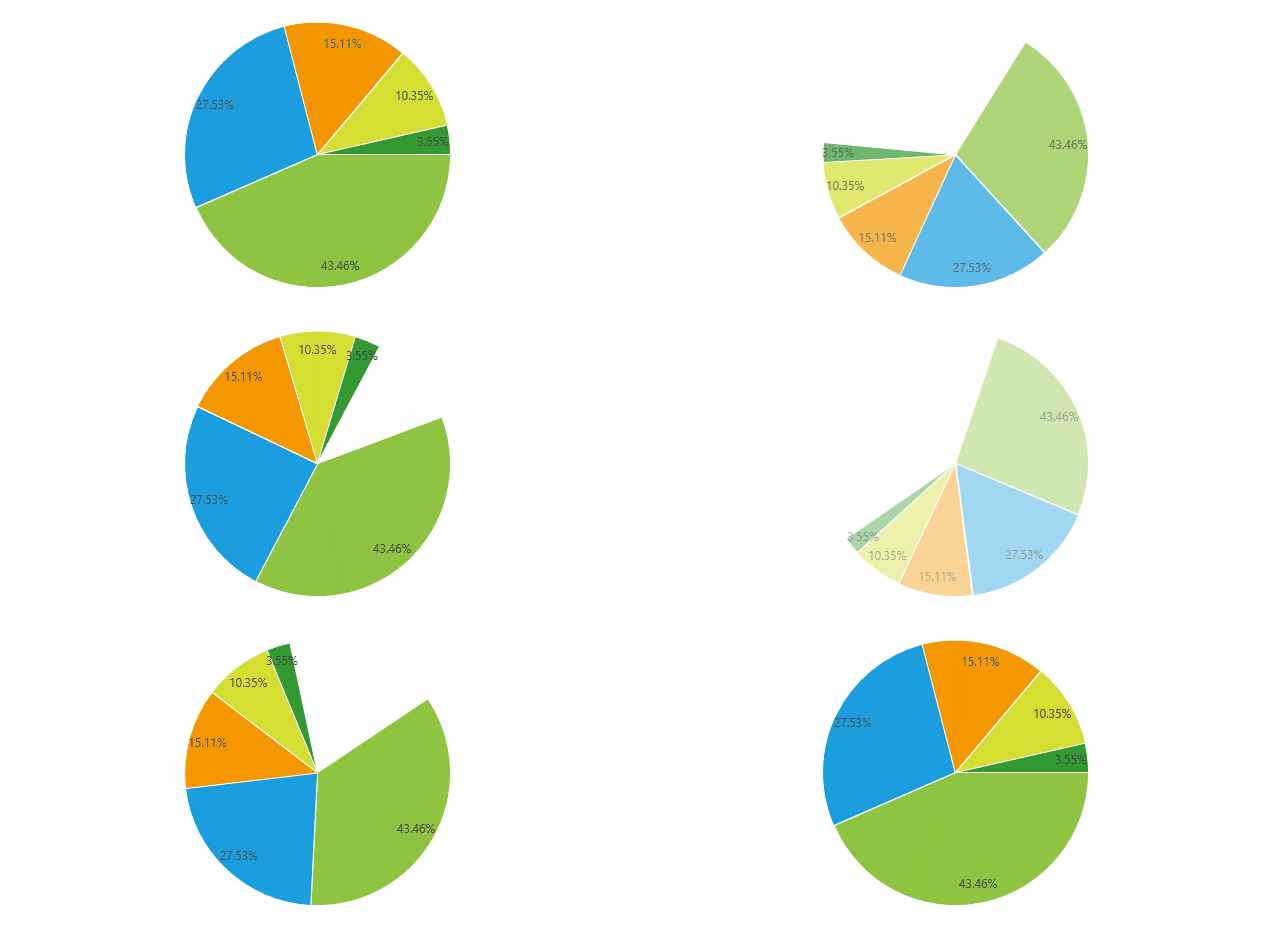
The PieChartAngleRangeAnimation build-in animation will animate the AngleRange property of the PieSeries and needs to be set to SeriesAnimation property.
The PieChartAngleRangeAnimation animates the AngleRange property of the PieSeries. It animates simultaneously the StartAngle and SweepAngle properties of the AngleRange. The StartAngle specifies the start angle from which the arc starts and the SweepAngle specifies the angle that defines the length of the arc. Their default value is (0,360). The first animation will animates the rotation of the pie starting from InitialStartAngle(-90) to StartAngle(0) and second animation will animate the unroll of the series staring from InitialSweepAngle(0) to SweepAngle(360).
- InitialStartAngle: A property of type double that gets or sets the initial value of the start angle. Default value is -90.
- InitialSweepAngle: A property of type double that gets or sets the initial value of the sweep angle. Default value is 0.
Example 6: Setting pie chart angle range animation in XAML
<telerik:RadPieChart Palette="Windows8">
    <telerik:RadPieChart.Series>
        <telerik:PieSeries>
            <telerik:PieSeries.DataPoints>
                <telerik:PieDataPoint Label="43.46%" Value="43.46"/>
                <telerik:PieDataPoint Label="27.53%" Value="27.53"/>
                <telerik:PieDataPoint Label="15.11%" Value="15.11"/>
                <telerik:PieDataPoint Label="10.35%" Value="10.35"/>
                <telerik:PieDataPoint Label="3.55%" Value="3.55"/>
            </telerik:PieSeries.DataPoints>
            <telerik:PieSeries.SeriesAnimation>
                <telerik:PieChartAngleRangeAnimation InitialStartAngle="-90" InitialSweepAngle="180" Duration="0:0:0.8" />
            </telerik:PieSeries.SeriesAnimation>
        </telerik:PieSeries>
    </telerik:RadPieChart.Series>
</telerik:RadPieChart>
Figure 7: This animation look as follows
Pie Chart Radius Factor Animation
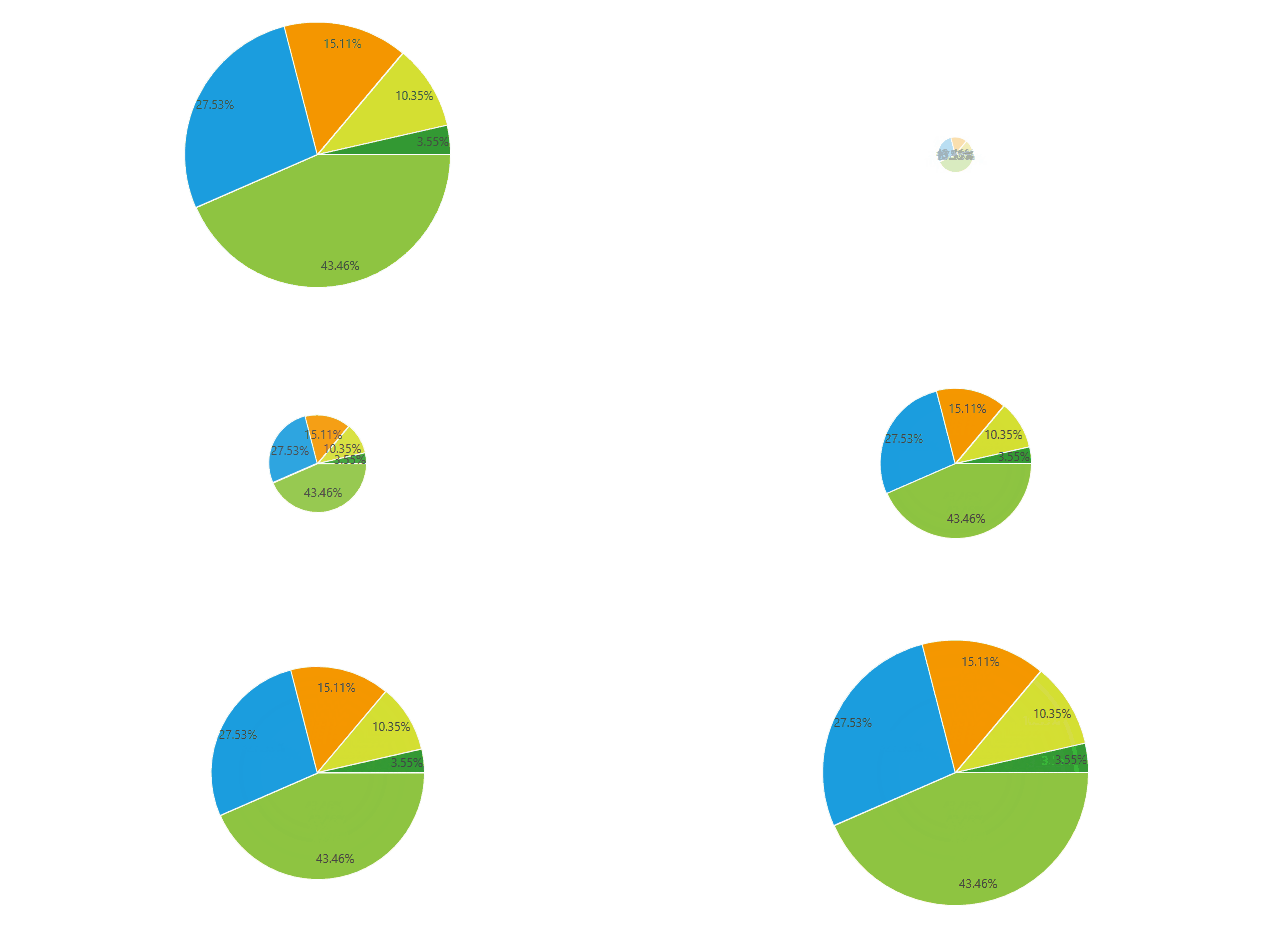
The PieChartRadiusFactorAnimation build-in animation will animate the RadiusFactor property of the PieSeries and needs to be set to SeriesAnimation property.
The PieChartRadiusFactorAnimation animates the RadiusFactor property of the PieSeries. The animation stars from 0 to the value of the RadiusFactor property.
Example 7: Setting pie chart radius factor animation in XAML
<telerik:RadPieChart Palette="Windows8">
    <telerik:RadPieChart.Series>
        <telerik:PieSeries>
            <telerik:PieSeries.DataPoints>
                <telerik:PieDataPoint Label="43.46%" Value="43.46"/>
                <telerik:PieDataPoint Label="27.53%" Value="27.53"/>
                <telerik:PieDataPoint Label="15.11%" Value="15.11"/>
                <telerik:PieDataPoint Label="10.35%" Value="10.35"/>
                <telerik:PieDataPoint Label="3.55%" Value="3.55"/>
            </telerik:PieSeries.DataPoints>
            <telerik:PieSeries.SeriesAnimation>
                <telerik:PieChartRadiusFactorAnimation Duration="0:0:1"/>
            </telerik:PieSeries.SeriesAnimation>
        </telerik:PieSeries>
    </telerik:RadPieChart.Series>
</telerik:RadPieChart>
Figure 8: This animation look as follows
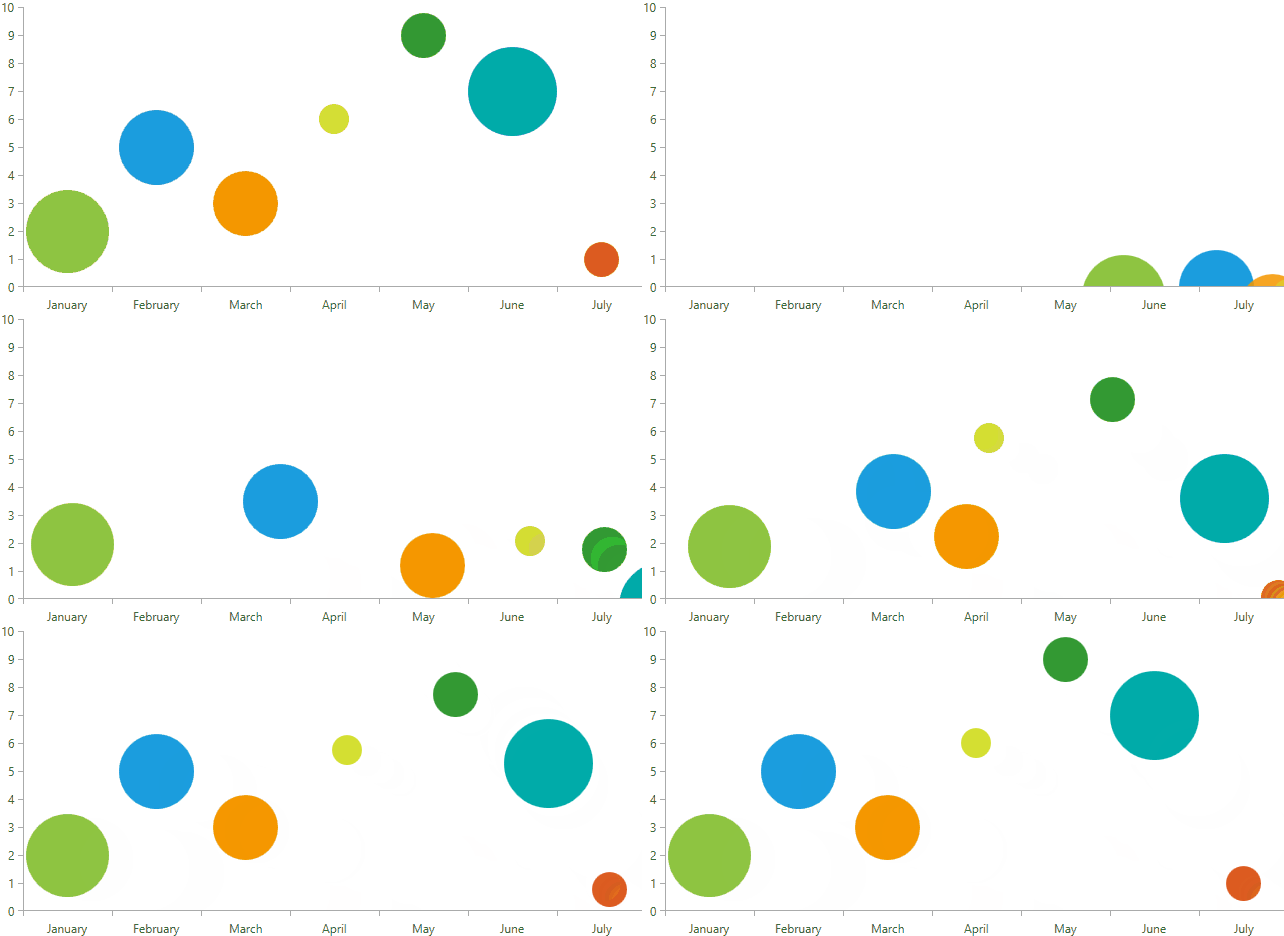
Custom Animation
All built-in animation of the chart derives from ChartAnimationBase. In order to create a custom animation, you need to define a custom class which derives from this base class. This class provides BuildPointAnimation() and BuildSeriesAnimation() methods which can be overridden so you can create your own animation. Example 2 demonstrate custom point animation.
Example 8: Custom point animation
public class CustomAnimation : ChartAnimationBase
{
    protected override RadAnimation BuildPointAnimation(FrameworkElement visual, DataPoint point, RadRect plotAreaClip)
    {
        AnimationGroup g = new AnimationGroup();
        g.Children.Add(new FadeAnimation());
        MoveAnimation moveAnimation = new MoveAnimation()
        {
            Duration = this.Duration,
            Easing = this.Easing,
        };
        double width = plotAreaClip.Right - point.LayoutSlot.X;
        double height = plotAreaClip.Bottom - point.LayoutSlot.Y;
        MoveAnimation.SetOldPosition(visual, new Point(width, height));
        MoveAnimation.SetCurrentPosition(visual, new Point(0, 0));
        g.Children.Add(moveAnimation);
        return g;
    }
}
Example 8: Setting custom animation in XAML
<telerik:RadCartesianChart  x:Name="chart" Palette="Windows8" >
    <telerik:RadCartesianChart.HorizontalAxis>
        <telerik:CategoricalAxis/>
    </telerik:RadCartesianChart.HorizontalAxis>
    <telerik:RadCartesianChart.VerticalAxis>
        <telerik:LinearAxis />
    </telerik:RadCartesianChart.VerticalAxis>
    <telerik:RadCartesianChart.Series>
        <telerik:BubbleSeries PaletteMode="DataPoint">
            <telerik:BubbleSeries.DataPoints>
                <telerik:BubbleDataPoint Category="January" Value="2" BubbleSize="83" />
                <telerik:BubbleDataPoint Category="February" Value="5" BubbleSize="75" />
                <telerik:BubbleDataPoint Category="March" Value="3" BubbleSize="65"/>
                <telerik:BubbleDataPoint Category="April" Value="6" BubbleSize="30"/>
                <telerik:BubbleDataPoint Category="May" Value="9" BubbleSize="45"/>
                <telerik:BubbleDataPoint Category="June" Value="7" BubbleSize="89"/>
                <telerik:BubbleDataPoint Category="July" Value="1" BubbleSize="35" />
            </telerik:BubbleSeries.DataPoints>
            <telerik:BubbleSeries.PointAnimation>
                <local:CustomAnimation Delay="0:0:0.125" Duration="0:0:1.55">
                    <local:CustomAnimation.Easing>
                        <BounceEase EasingMode="EaseOut" Bounces="20" Bounciness="5" />
                    </local:CustomAnimation.Easing>
                </local:CustomAnimation>
            </telerik:BubbleSeries.PointAnimation>
        </telerik:BubbleSeries>
    </telerik:RadCartesianChart.Series>
</telerik:RadCartesianChart>
Figure 9: This custom animation look as follows
Events
This section covers the events exposed for the animation.
- PointAnimationsCompleted: This event is fired when the animation for all datapoints of the series is completed.
- SeriesAnimationCompleted: This event is fired when the animation of the series is completed.
Series Animations Support
The RadChartView series supports animations for its series and data points. Depending on the type of the series, the supported animation can be SeriesAnimation or PointAnimation, or as in some series, both.
CartesianChart Series
| Series | Series Animation | Point Animation |
|---|---|---|
| Area Series | YES | YES |
| Bar Series | NO | YES |
| Bubble Series | NO | YES |
| CandleStick Series | NO | YES |
| Line Series | YES | YES |
| OHLC Series | NO | YES |
| Point Series | NO | YES |
| Range Bar Series | NO | YES |
| Range Series | YES | NO |
| Range Spline Series | YES | NO |
| Scatter Area Series | YES | YES |
| Scatter Bubble Series | NO | YES |
| Scatter Line Series | YES | YES |
| Scatter Point Series | NO | YES |
| Scatter Spline Area Series | YES | YES |
| Scatter Spline Series | YES | YES |
| Spline Area Series | YES | YES |
| Spline Series | YES | YES |
| Step Area Series | YES | YES |
| Step Line Series | YES | YES |
PieChart Series
| Series | Series Animation | Point Animation |
|---|---|---|
| Pie Series | YES | YES |
| Dougnat Series | YES | YES |
PolarChart Series
| Series | Series Animation | Point Animation |
|---|---|---|
| Polar Area Series | YES | YES |
| Polar Line Series | YES | YES |
| Polar Point Series | NO | YES |
| Radar Area Series | YES | YES |
| Radar Line Series | YES | YES |
| Radar Point Series | NO | YES |
FunnelChart Series
| Series | Series Animation | Point Animation |
|---|---|---|
| Funnel Series | NO | YES |
Notes
Internally in our code, there is Telerik.Windows.Controls.Animation.CircleEase function. When specifying CircleEase function to the Easing property of the animation you have to use the WPF predefined Sysmtem.Windows.Media.Animation.CicleEase or exception will be thrown.
Labels in PointAnimation are not animated.
When using ScaleAnimation the MaxScale property should not be set to a value bigger than 1. Value bigger than 1 will lead to potential misposition of chart elements.