New to Telerik UI for WPF? Download free 30-day trial

OriginValue

Some series in the RadChartView suite have a mechanism which allows for determining from where the data points start drawing. This can be utilized by setting the OriginValue property of the series. Example 1 demonstrates this property.

The series which support this property are: AreaSeries, ScatterAreaSeries, ScatterSplineAreaSeries, SplineAreaSeries, StepAreaSeries and BarSeries.

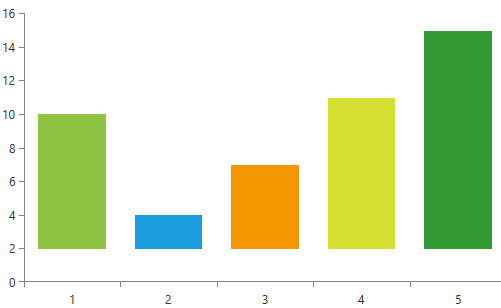
Example 1: BarSeries with OriginValue

    <telerik:RadCartesianChart Palette="Windows8"> 
        <telerik:RadCartesianChart.HorizontalAxis> 
            <telerik:CategoricalAxis/> 
        </telerik:RadCartesianChart.HorizontalAxis> 
 
        <telerik:RadCartesianChart.VerticalAxis> 
            <telerik:LinearAxis/> 
        </telerik:RadCartesianChart.VerticalAxis> 
 
        <telerik:RadCartesianChart.Series> 
            <telerik:BarSeries OriginValue="2" PaletteMode="DataPoint"> 
                <telerik:BarSeries.DataPoints> 
                    <telerik:CategoricalDataPoint Category="1" Value="10"/> 
                    <telerik:CategoricalDataPoint Category="2" Value="4"/> 
                    <telerik:CategoricalDataPoint Category="3" Value="7"/> 
                    <telerik:CategoricalDataPoint Category="4" Value="11"/> 
                    <telerik:CategoricalDataPoint Category="5" Value="15"/> 
                </telerik:BarSeries.DataPoints> 
            </telerik:BarSeries> 
        </telerik:RadCartesianChart.Series> 
    </telerik:RadCartesianChart> 

Figure 1: Result from Example 1

RadChartView OriginValue

For a demonstration in a different scenario, you can check out the OriginValue RadChartView SDK example.

See also

In this article