Create Data Bound Chart
RadChart is an advanced WPF control providing full Blend support. From within the visual environment of Blend, you can easily perform various tasks such as edit control properties, modify themes, create and modify templates and more.
This tutorial will walk you through the creation of a RadChart and will show how to:
- Add RadChart using Expression Blend
- Create and bind SplineChart to collection of custom objects using SeriesMapping/ItemMapping
- Create categorical chart
Before reading this tutorial you should get familiar with the Visual Structure of the standard RadChart control and its elements.
For the purpose of this tutorial, you will need to create an empty WPF Application project and open it in Blend.
Adding RadChart
-
Open the Asset Library (Window->Assets) in Expression Blend and start writing the name of the RadChart in the search box.
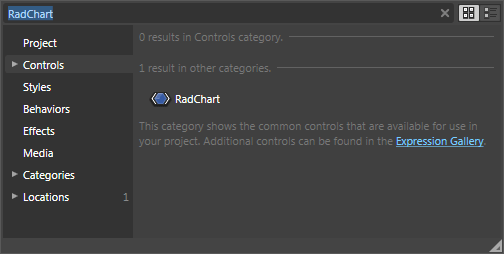
Drag a RadChart on the artboard.
As result you can see the RadChart with some demo data displayed. The underlaying XAML is pretty simple and looks like this:
<telerik:RadChart x:Name="radChart"
                  Content="RadChart"/>
There are two things you should pay attention to: First is the declaration of the Telerik.Windows.Controls namespace from Telerik.Windows.Controls.Charting assembly and the second is the declaration of the RadChart control itself.
Creating Custom Data Object
- In order to bind your RadChart you will need custom data object. Let's create one and name it ProductSales, add the properties as shown below:
public class ProductSales
{
    public ProductSales( int quantity, int month, string monthName )
    {
        this.Quantity = quantity;
        this.Month = month;
        this.MonthName = monthName;
    }
    public int Quantity
    {
        get;
        set;
    }
    public int Month
    {
        get;
        set;
    }
    public string MonthName
    {
        get;
        set;
    }
}
Public Class ProductSales
    Public Sub New(ByVal quantity As Integer, ByVal month As Integer, ByVal monthName As String)
        Me.Quantity = quantity
        Me.Month = month
        Me.MonthName = monthName
    End Sub
    Private _Quantity As Integer
    Public Property Quantity() As Integer
        Get
            Return _Quantity
        End Get
        Set(ByVal value As Integer)
            _Quantity = value
        End Set
    End Property
    Private _Month As Integer
    Public Property Month() As Integer
        Get
            Return _Month
        End Get
        Set(ByVal value As Integer)
            _Month = value
        End Set
    End Property
    Private _MonthName As String
    Public Property MonthName() As String
        Get
            Return _MonthName
        End Get
        Set(ByVal value As String)
            _MonthName = value
        End Set
    End Property
End Class
- Now create custom method that returns collection populated with several ProductSales objects.
private List<ProductSales> CreateData()
{
    List<ProductSales> persons = new List<ProductSales>();
    persons.Add( new ProductSales( 154, 1, "January" ) );
    persons.Add( new ProductSales( 138, 2, "February" ) );
    persons.Add( new ProductSales( 143, 3, "March" ) );
    persons.Add( new ProductSales( 120, 4, "April" ) );
    persons.Add( new ProductSales( 135, 5, "May" ) );
    persons.Add( new ProductSales( 125, 6, "June" ) );
    persons.Add( new ProductSales( 179, 7, "July" ) );
    persons.Add( new ProductSales( 170, 8, "August" ) );
    persons.Add( new ProductSales( 198, 9, "September" ) );
    persons.Add( new ProductSales( 187, 10, "October" ) );
    persons.Add( new ProductSales( 193, 11, "November" ) );
    persons.Add( new ProductSales( 212, 12, "December" ) );
    return persons;
}
Private Function CreateData() As List(Of ProductSales)
    Dim persons As New List(Of ProductSales)()

    persons.Add(New ProductSales(154, 1, "January"))
    persons.Add(New ProductSales(138, 2, "February"))
    persons.Add(New ProductSales(143, 3, "March"))
    persons.Add(New ProductSales(120, 4, "April"))
    persons.Add(New ProductSales(135, 5, "May"))
    persons.Add(New ProductSales(125, 6, "June"))
    persons.Add(New ProductSales(179, 7, "July"))
    persons.Add(New ProductSales(170, 8, "August"))
    persons.Add(New ProductSales(198, 9, "September"))
    persons.Add(New ProductSales(187, 10, "October"))
    persons.Add(New ProductSales(193, 11, "November"))
    persons.Add(New ProductSales(212, 12, "December"))

    Return persons
End Function
Binding the RadChart
- Now after you have the needed data object it is time to configure and bind the RadChart to the appropriate properties of the ProductSales class. It can be done using SeriesMapping/ItemMapping from XAML or code-behind, but in most cases it is better to do it declaratively.
<telerik:RadChart x:Name="radChart">
    <telerik:RadChart.SeriesMappings>
        <telerik:SeriesMapping LegendLabel="Product Sales">
            <telerik:SeriesMapping.SeriesDefinition>
                <telerik:SplineSeriesDefinition />
            </telerik:SeriesMapping.SeriesDefinition>
            <telerik:SeriesMapping.ItemMappings>
                <telerik:ItemMapping DataPointMember="XValue" FieldName="Month" />
                <telerik:ItemMapping DataPointMember="YValue" FieldName="Quantity" />
            </telerik:SeriesMapping.ItemMappings>
        </telerik:SeriesMapping>
    </telerik:RadChart.SeriesMappings>
</telerik:RadChart>
SeriesMapping seriesMapping = new SeriesMapping();
seriesMapping.LegendLabel = "Product Sales";
seriesMapping.SeriesDefinition = new SplineSeriesDefinition();
seriesMapping.ItemMappings.Add( new ItemMapping( "Month", DataPointMember.XValue ) );
seriesMapping.ItemMappings.Add( new ItemMapping("Quantity", DataPointMember.YValue));
radChart.SeriesMappings.Add( seriesMapping );
this.radChart.ItemsSource = this.CreateData();
Dim seriesMapping As New SeriesMapping()
seriesMapping.LegendLabel = "Product Sales"
seriesMapping.SeriesDefinition = New SplineSeriesDefinition()
seriesMapping.ItemMappings.Add(New ItemMapping("Month", DataPointMember.XValue))
seriesMapping.ItemMappings.Add(New ItemMapping("Quantity", DataPointMember.YValue))
radChart.SeriesMappings.Add(seriesMapping)
Me.radChart.ItemsSource = Me.CreateData()
In the source code above one instance of the class SeriesMapping is created with two ItemMappings, one for X-axis and one for Y-axis. X-axis is bound to the ProductSales.Month property, while Y-axis is bound to ProductSales.Quantity property. Both properties are numeric, that's why their DataPointMember property is set to XValue and YValue respectively. If you want to bind your X-axis to string values read Categorical Charts or read below.
- And the last step is to set the ItemSource of the RadChart control to the collection returned by the GetData method. You can insert this call inside your Constructor right after the InitializeComponent() method call.
this.radChart.ItemsSource = this.CreateData();
Me.radChart.ItemsSource = Me.CreateData()
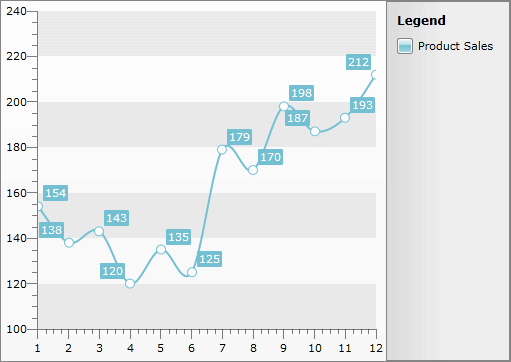
Now if you run your application, the result should be similar to the below snapshot. Note that:
RadChart has automatically generated value ranges for both axes X and Y, based on the values provided by the data source. If needed you can specify the ranges manually.
The Chart Legend is also generated automatically, containing information about the only one available series "Product Sales".
X-Axis shows the month numbers.
Y-Axis shows the sold quantity values.
Spline connects all dots in one smooth graphic
Creating Categorical Chart
The X-axis can be further customized by replacing the month numbers (1, 2, 3...) with the respective month names (January, February, March...). To achieve this we have to set the ItemMapping.DataPointMember property for the X-axis to XCategory and the ItemMapping.FieldName to "MonthName", as shown in the samples below.
<telerik:ItemMapping DataPointMember="XCategory" FieldName="MonthName" />
seriesMapping.ItemMappings.Add(new ItemMapping("MonthName", DataPointMember.XCategory));
seriesMapping.ItemMappings.Add(New ItemMapping("MonthName", DataPointMember.XCategory))
And here is the same chart but this time showing month names as categories for the X-axis instead of the month numbers.
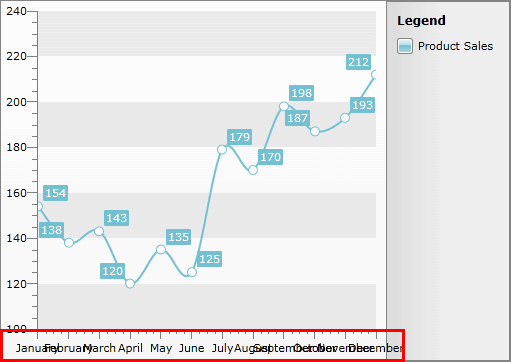
To make the x-Axis labels more readable you can use one of the label features provided by the XAxis class. For more information read here.
If you need further customizations of the chart you can take a look at some of the following topics:
Change the Layout Mode of the chart.
Format your labels using Format Expressions.
Change your Chart Point-marks.
Improve your Interactivity using ToolTips.
Customize your Chart Title, Chart Legend or Chart Area.
Show Multi-series Charts.
Customize the chart Animations.
Change the Striplines and Gridlines of both axes.
If you need to know more about RadChart data binding, take a look at the following topics: