Data Binding with Automatic Series Mappings
One of the features of the RadChart is the automatic series mapping. With automatic series mapping, you can easily create a chart by simply setting the RadChart.ItemsSource to the data source you have. RadChart will create a chart series for every numeric field in the data source by mapping the numeric value to the DataPointMember.YValue field for each respective series. The type of the chart depends on the RadChart.DefaultSeriesDefinition property and by default it is set to BarSeriesDefinition.
Note that SeriesDefinition set through the RadChart.DefaultSeriesDefinition property does not support change notifications i.e. if you try to change a RadChart.DefaultSeriesDefinition property after the control is databound, it will not have any effect till the next rebind operation. The recommended approach in this scenario would be to use unique SeriesMapping.SeriesDefinition or alternatively you can access the generated DataSeries directly (i.e. RadChart.DefaultView.ChartArea.DataSeries[i]) and update its DataSeries.Definition properties.
The purpose of this tutorial is to show you how to use RadChart with Automatic Series Mappings. The following cases will be examined:
The automatic mapping mode will not work for chart series that require multiple data fields for its correct operation (e.g. the CandleStick type).
Binding to an Array of Integers
Take a look at this simple array declaration:
int[] dataArray = new int[] { 12, 56, 23, 89, 12, 56, 34, 78, 32, 56 };
Dim dataArray As Integer() = New Integer() {12, 56, 23, 89, 12, 56, 34, 78, 32, 56}
If you set it to the ItemsSource property of the RadChart control, you will have the following result:
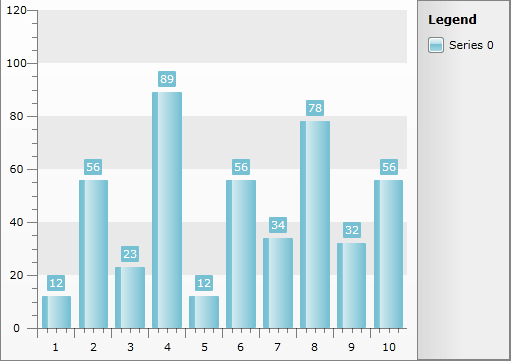
radChart.ItemsSource = dataArray;
radChart.ItemsSource = dataArray
Binding to a List of Business Objects
If you have a list of business objects and you set it to the ItemsSource property of the RadChart control, the result will be one chart series per numeric property:
List<Manufacturer> data = new List<Manufacturer>();
data.Add(new Manufacturer("Toyota", 215, 462));
data.Add(new Manufacturer("General Motors", 192, 345));
data.Add(new Manufacturer("Volkswagen", 151, 310));
data.Add(new Manufacturer("Ford", 125, 340));
data.Add(new Manufacturer("Honda", 91, 201));
data.Add(new Manufacturer("Nissan", 79, 145));
data.Add(new Manufacturer("PSA", 79, 175));
data.Add(new Manufacturer("Hyundai", 64, 133));

this.telerkChart.ItemsSource = data;
Dim data As New List(Of Manufacturer)()
data.Add(New Manufacturer("Toyota", 215, 462))
data.Add(New Manufacturer("General Motors", 192, 345))
data.Add(New Manufacturer("Volkswagen", 151, 310))
data.Add(New Manufacturer("Ford", 125, 340))
data.Add(New Manufacturer("Honda", 91, 201))
data.Add(New Manufacturer("Nissan", 79, 145))
data.Add(New Manufacturer("PSA", 79, 175))
data.Add(New Manufacturer("Hyundai", 64, 133))

Me.telerkChart.ItemsSource = data
Where the structure of the Manufacturer class is:
public class Manufacturer
{
    public Manufacturer( string name, int sales, int turnover )
    {
        this.Name = name;
        this.Sales = sales;
        this.Turnover = turnover;
    }
    public string Name
    {
        get;
        set;
    }
    public int Sales
    {
        get;
        set;
    }
    public int Turnover
    {
        get;
        set;
    }
}
Public Class Manufacturer
    Public Sub New(ByVal name As String, ByVal sales As Integer, ByVal turnover As Integer)
        Me.Name = name
        Me.Sales = sales
        Me.Turnover = turnover
    End Sub

    Private _Name As String
    Public Property Name() As String
        Get
            Return _Name
        End Get
        Set(ByVal value As String)
            _Name = value
        End Set
    End Property

    Private _Sales As Integer
    Public Property Sales() As Integer
        Get
            Return _Sales
        End Get
        Set(ByVal value As Integer)
            _Sales = value
        End Set
    End Property

    Private _Turnover As Integer
    Public Property Turnover() As Integer
        Get
            Return _Turnover
        End Get
        Set(ByVal value As Integer)
            _Turnover = value
        End Set
    End Property
End Class
The result is shown on the next figure.
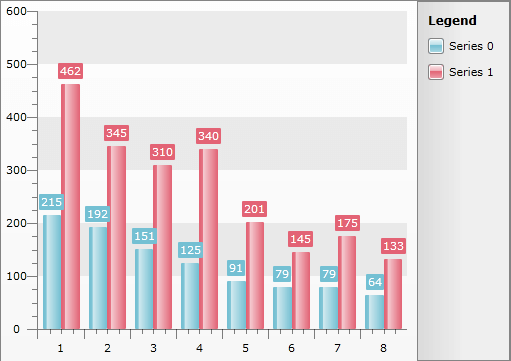
As you can see, automatic series mapping can be useful for simple data. However, if you need more data binding options, take a look at the Data Binding with Manual Series Mapping topic and the Data Binding to Nested Collections topic.