Data Binding with Manual Series Mapping
Besides the automatic series mapping, RadChart supports manual series mapping where you have a full control on how the data is bound to the chart.
The manual series mapping offers you the following opportunities:
You can explicitly define which data field from the underlying data source to be bound to which data point member.
To set labels of the chart series.
To bind to nested collections.
To create categorical charts.
Note that series definitions set through the SeriesMapping.SeriesDefinition property provide full support for change notifications with the exception of grouping scenarios i.e. if you will be dynamically changing the series appearance (e.g. SeriesDefinition.Appearance.Fill / Stroke properties), the recommended approach would be to assign unique SeriesDefinition instance to each SeriesMapping instance in your chart control.
For grouping scenarios you can access the generated DataSeries directly (i.e. RadChart.DefaultView.ChartArea.DataSeries[i]) and update its DataSeries.Definition properties.
Note that you cannot reuse series definitions in this scenario (i.e. assign single definition instance to multiple mappings) as changing a definition property would be propagated to all series (e.g. you have 3 series mappings that hold reference to single BarSeriesDefinition -- setting any SeriesMapping.SeriesDefinition.Appearance.Fill to Purple, would case all 3 series to change their color to Purple and that is hardly the expected result).
The purpose of this tutorial is to show you how to use RadChart with Manual Series Mapping.
The chart types that require multiple data fields, like Stick or CandleStick, need manual series mapping in order to operate correctly.
1 . Create a new business object and name it TradeData.
public class TradeData
{
    public string Emission
    {
        get;
        set;
    }
    public DateTime FromDate
    {
        get;
        set;
    }
    public DateTime ToDate
    {
        get;
        set;
    }
    public double Open
    {
        get;
        set;
    }
    public double High
    {
        get;
        set;
    }
    public double Low
    {
        get;
        set;
    }
    public double Close
    {
        get;
        set;
    }
    public double Volume
    {
        get;
        set;
    }
    public static ObservableCollection<TradeData> GetWeeklyData( string code )
    {
        ObservableCollection<TradeData> tradeData;
        tradeData = new ObservableCollection<TradeData>() {
            new TradeData() { Emission="MSFT", FromDate = new DateTime( 2009, 8, 10 ), Open = 23.4600, High = 23.5500, Low = 23.3000, Close = 23.4200, Volume = 35258950 },
            new TradeData() { Emission="MSFT", FromDate = new DateTime( 2009, 8, 11 ), Open = 23.3200, High = 23.4000, Low = 23.0500, Close = 23.1300, Volume = 33611790 },
            new TradeData() { Emission="MSFT", FromDate = new DateTime( 2009, 8, 12 ), Open = 23.1300, High = 23.9000, Low = 23.0300, Close = 23.5300, Volume = 61936270 },
            new TradeData() { Emission="MSFT", FromDate = new DateTime( 2009, 8, 13 ), Open = 23.6300, High = 23.8500, Low = 23.4000, Close = 23.6200, Volume = 38951990 },
            new TradeData() { Emission="MSFT", FromDate = new DateTime( 2009, 8, 14 ), Open = 23.6200, High = 23.8000, Low = 23.5100, Close = 23.6900, Volume = 46328540 },
            new TradeData() { Emission="MSFT", FromDate = new DateTime( 2009, 8, 17 ), Open = 23.3200, High = 23.6000, Low = 23.2300, Close = 23.2500, Volume = 42462890 },
            new TradeData() { Emission="MSFT", FromDate = new DateTime( 2009, 8, 18 ), Open = 23.2900, High = 23.6520, Low = 23.2700, Close = 23.5800, Volume = 38831620 },
            new TradeData() { Emission="MSFT", FromDate = new DateTime( 2009, 8, 19 ), Open = 23.2500, High = 23.7200, Low = 23.2500, Close = 23.6500, Volume = 41814320 },
            new TradeData() { Emission="MSFT", FromDate = new DateTime( 2009, 8, 20 ), Open = 23.6000, High = 23.8700, Low = 23.5400, Close = 23.6700, Volume = 39502680 },
            new TradeData() { Emission="MSFT", FromDate = new DateTime( 2009, 8, 21 ), Open = 23.9300, High = 24.4200, Low = 23.7700, Close = 24.4100, Volume = 68995700},
            new TradeData() { Emission="MSFT", FromDate = new DateTime( 2009, 8, 24 ), Open = 24.4100, High = 24.7326, Low = 24.2800, Close = 24.6400, Volume = 54159300 },
            new TradeData() { Emission="MSFT", FromDate = new DateTime( 2009, 8, 25 ), Open = 24.6000, High = 24.8200, Low = 24.4600, Close = 24.6400, Volume = 43961480 },
            new TradeData() { Emission="MSFT", FromDate = new DateTime( 2009, 8, 26 ), Open = 24.5900, High = 24.7500, Low = 24.4200, Close = 24.5500, Volume = 41060010 },
            new TradeData() { Emission="MSFT", FromDate = new DateTime( 2009, 8, 27 ), Open = 24.4100, High = 24.7800, Low = 24.3000, Close = 24.6900, Volume = 45433940 },
            new TradeData() { Emission="MSFT", FromDate = new DateTime( 2009, 8, 28 ), Open = 25.0700, High = 25.4900, Low = 24.6100, Close = 24.6800, Volume = 55789640 },
            new TradeData() { Emission="MSFT", FromDate = new DateTime( 2009, 8, 31 ), Open = 24.5700, High = 24.8500, Low = 24.2900, Close = 24.6500, Volume = 49582950 },
            new TradeData() { Emission="MSFT", FromDate = new DateTime( 2009, 9, 1 ), Open = 24.3500, High = 24.7400, Low = 23.9000, Close = 24.0000, Volume = 62571800 },
            new TradeData() { Emission="MSFT", FromDate = new DateTime( 2009, 9, 2 ), Open = 23.8200, High = 24.1400, Low = 23.7800, Close = 23.8600, Volume = 40726040 },
            new TradeData() { Emission="MSFT", FromDate = new DateTime( 2009, 9, 3 ), Open = 23.9100, High = 24.1400, Low = 23.7600, Close = 24.1100, Volume = 34110810 },
            new TradeData() { Emission="MSFT", FromDate = new DateTime( 2009, 9, 4 ), Open = 24.0900, High = 24.8001, Low = 24.0800, Close = 24.6200, Volume = 44987570 },
            new TradeData() { Emission="MSFT", FromDate = new DateTime( 2009, 9, 8 ), Open = 24.6200, High = 24.8400, Low = 24.4100, Close = 24.8200, Volume = 52243880 } };
        return tradeData;
    }
}
Public Class TradeData
    Public Property Emission() As String
        Get
            Return m_Emission
        End Get
        Set(value As String)
            m_Emission = value
        End Set
    End Property
    Private m_Emission As String
    Public Property FromDate() As DateTime
        Get
            Return m_FromDate
        End Get
        Set(value As DateTime)
            m_FromDate = value
        End Set
    End Property
    Private m_FromDate As DateTime
    Public Property ToDate() As DateTime
        Get
            Return m_ToDate
        End Get
        Set(value As DateTime)
            m_ToDate = value
        End Set
    End Property
    Private m_ToDate As DateTime
    Public Property Open() As Double
        Get
            Return m_Open
        End Get
        Set(value As Double)
            m_Open = value
        End Set
    End Property
    Private m_Open As Double
    Public Property High() As Double
        Get
            Return m_High
        End Get
        Set(value As Double)
            m_High = value
        End Set
    End Property
    Private m_High As Double
    Public Property Low() As Double
        Get
            Return m_Low
        End Get
        Set(value As Double)
            m_Low = value
        End Set
    End Property
    Private m_Low As Double
    Public Property Close() As Double
        Get
            Return m_Close
        End Get
        Set(value As Double)
            m_Close = value
        End Set
    End Property
    Private m_Close As Double
    Public Property Volume() As Double
        Get
            Return m_Volume
        End Get
        Set(value As Double)
            m_Volume = value
        End Set
    End Property
    Private m_Volume As Double
    Public Shared Function GetWeeklyData(code As String) As ObservableCollection(Of TradeData)
        Dim tradeData As ObservableCollection(Of TradeData)
        tradeData = New ObservableCollection(Of TradeData)() From { _
            New TradeData() With { _
                .Emission = "MSFT", _
                .FromDate = New DateTime(2009, 8, 10), _
                .Open = 23.46, _
                .High = 23.55, _
                .Low = 23.3, _
                .Close = 23.42, _
                .Volume = 35258950 _
            }, _
            New TradeData() With { _
                .Emission = "MSFT", _
                .FromDate = New DateTime(2009, 8, 11), _
                .Open = 23.32, _
                .High = 23.4, _
                .Low = 23.05, _
                .Close = 23.13, _
                .Volume = 33611790 _
            }, _
            New TradeData() With { _
                .Emission = "MSFT", _
                .FromDate = New DateTime(2009, 8, 12), _
                .Open = 23.13, _
                .High = 23.9, _
                .Low = 23.03, _
                .Close = 23.53, _
                .Volume = 61936270 _
            }, _
            New TradeData() With { _
                .Emission = "MSFT", _
                .FromDate = New DateTime(2009, 8, 13), _
                .Open = 23.63, _
                .High = 23.85, _
                .Low = 23.4, _
                .Close = 23.62, _
                .Volume = 38951990 _
            }, _
            New TradeData() With { _
                .Emission = "MSFT", _
                .FromDate = New DateTime(2009, 8, 14), _
                .Open = 23.62, _
                .High = 23.8, _
                .Low = 23.51, _
                .Close = 23.69, _
                .Volume = 46328540 _
            }, _
            New TradeData() With { _
                .Emission = "MSFT", _
                .FromDate = New DateTime(2009, 8, 17), _
                .Open = 23.32, _
                .High = 23.6, _
                .Low = 23.23, _
                .Close = 23.25, _
                .Volume = 42462890 _
            }, _
            New TradeData() With { _
                .Emission = "MSFT", _
                .FromDate = New DateTime(2009, 8, 18), _
                .Open = 23.29, _
                .High = 23.652, _
                .Low = 23.27, _
                .Close = 23.58, _
                .Volume = 38831620 _
            }, _
            New TradeData() With { _
                .Emission = "MSFT", _
                .FromDate = New DateTime(2009, 8, 19), _
                .Open = 23.25, _
                .High = 23.72, _
                .Low = 23.25, _
                .Close = 23.65, _
                .Volume = 41814320 _
            }, _
            New TradeData() With { _
                .Emission = "MSFT", _
                .FromDate = New DateTime(2009, 8, 20), _
                .Open = 23.6, _
                .High = 23.87, _
                .Low = 23.54, _
                .Close = 23.67, _
                .Volume = 39502680 _
            }, _
            New TradeData() With { _
                .Emission = "MSFT", _
                .FromDate = New DateTime(2009, 8, 21), _
                .Open = 23.93, _
                .High = 24.42, _
                .Low = 23.77, _
                .Close = 24.41, _
                .Volume = 68995700 _
            }, _
            New TradeData() With { _
                .Emission = "MSFT", _
                .FromDate = New DateTime(2009, 8, 24), _
                .Open = 24.41, _
                .High = 24.7326, _
                .Low = 24.28, _
                .Close = 24.64, _
                .Volume = 54159300 _
            }, _
            New TradeData() With { _
                .Emission = "MSFT", _
                .FromDate = New DateTime(2009, 8, 25), _
                .Open = 24.6, _
                .High = 24.82, _
                .Low = 24.46, _
                .Close = 24.64, _
                .Volume = 43961480 _
            }, _
            New TradeData() With { _
                .Emission = "MSFT", _
                .FromDate = New DateTime(2009, 8, 26), _
                .Open = 24.59, _
                .High = 24.75, _
                .Low = 24.42, _
                .Close = 24.55, _
                .Volume = 41060010 _
            }, _
            New TradeData() With { _
                .Emission = "MSFT", _
                .FromDate = New DateTime(2009, 8, 27), _
                .Open = 24.41, _
                .High = 24.78, _
                .Low = 24.3, _
                .Close = 24.69, _
                .Volume = 45433940 _
            }, _
            New TradeData() With { _
                .Emission = "MSFT", _
                .FromDate = New DateTime(2009, 8, 28), _
                .Open = 25.07, _
                .High = 25.49, _
                .Low = 24.61, _
                .Close = 24.68, _
                .Volume = 55789640 _
            }, _
            New TradeData() With { _
                .Emission = "MSFT", _
                .FromDate = New DateTime(2009, 8, 31), _
                .Open = 24.57, _
                .High = 24.85, _
                .Low = 24.29, _
                .Close = 24.65, _
                .Volume = 49582950 _
            }, _
            New TradeData() With { _
                .Emission = "MSFT", _
                .FromDate = New DateTime(2009, 9, 1), _
                .Open = 24.35, _
                .High = 24.74, _
                .Low = 23.9, _
                .Close = 24.0, _
                .Volume = 62571800 _
            }, _
            New TradeData() With { _
                .Emission = "MSFT", _
                .FromDate = New DateTime(2009, 9, 2), _
                .Open = 23.82, _
                .High = 24.14, _
                .Low = 23.78, _
                .Close = 23.86, _
                .Volume = 40726040 _
            }, _
            New TradeData() With { _
                .Emission = "MSFT", _
                .FromDate = New DateTime(2009, 9, 3), _
                .Open = 23.91, _
                .High = 24.14, _
                .Low = 23.76, _
                .Close = 24.11, _
                .Volume = 34110810 _
            }, _
            New TradeData() With { _
                .Emission = "MSFT", _
                .FromDate = New DateTime(2009, 9, 4), _
                .Open = 24.09, _
                .High = 24.8001, _
                .Low = 24.08, _
                .Close = 24.62, _
                .Volume = 44987570 _
            }, _
            New TradeData() With { _
                .Emission = "MSFT", _
                .FromDate = New DateTime(2009, 9, 8), _
                .Open = 24.62, _
                .High = 24.84, _
                .Low = 24.41, _
                .Close = 24.82, _
                .Volume = 52243880 _
            } _
            }
        Return tradeData
    End Function
End Class
2 . Add a new RadChart declaration.
<Grid x:Name="LayoutRoot"
Background="White">
    <telerik:RadChart x:Name="radChart">
        <telerik:RadChart.DefaultView>
            <telerik:ChartDefaultView>
                <telerik:ChartDefaultView.ChartTitle>
                    <telerik:ChartTitle Content="Trade Data" />
                </telerik:ChartDefaultView.ChartTitle>
            </telerik:ChartDefaultView>
        </telerik:RadChart.DefaultView>
    </telerik:RadChart>
</Grid>
3 . In order to map to such kind of business objects, you have to create a new instance of SeriesMapping. Set the SeriesMapping.SeriesDefinition property to the chart type you want to use - in this case CandleStickSeriesDefinition.
You can find a full list of supported chart types here.
<telerik:RadChart x:Name="radChart">
    <telerik:RadChart.SeriesMappings>
        <telerik:SeriesMapping LegendLabel="MSFT">
            <telerik:SeriesMapping.SeriesDefinition>
                <telerik:CandleStickSeriesDefinition/>
            </telerik:SeriesMapping.SeriesDefinition>
        </telerik:SeriesMapping>
    </telerik:RadChart.SeriesMappings>
</telerik:RadChart>
4 . Add several ItemMappings - one for each of the properties that take part in the candlestick chart type. For each ItemMapping must be set the following properties:
5 . DataPointMember
6 . FieldName - specifies from where the data should be taken.
<telerik:RadChart x:Name="radChart">
    <telerik:RadChart.DefaultView>
        <telerik:ChartDefaultView>
            <telerik:ChartDefaultView.ChartTitle>
                <telerik:ChartTitle Content="Trade Data" />
            </telerik:ChartDefaultView.ChartTitle>
        </telerik:ChartDefaultView>
    </telerik:RadChart.DefaultView>
    <telerik:RadChart.SeriesMappings>
        <telerik:SeriesMapping LegendLabel="MSFT">
            <telerik:SeriesMapping.SeriesDefinition>
                <telerik:CandleStickSeriesDefinition />
            </telerik:SeriesMapping.SeriesDefinition>
            <telerik:SeriesMapping.ItemMappings>
                <telerik:ItemMapping DataPointMember="Open"
                                        FieldName="Open" />
                <telerik:ItemMapping DataPointMember="High"
                                        FieldName="High" />
                <telerik:ItemMapping DataPointMember="Low"
                                        FieldName="Low" />
                <telerik:ItemMapping DataPointMember="Close"
                                        FieldName="Close" />
            </telerik:SeriesMapping.ItemMappings>
        </telerik:SeriesMapping>
    </telerik:RadChart.SeriesMappings>
</telerik:RadChart>
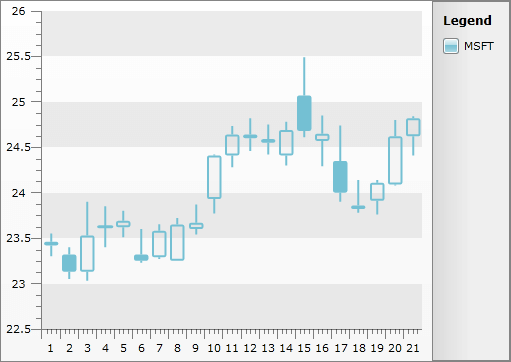
7 . Set the ItemsSource property of the RadChart control.
//Gets trading data
this.radChart.ItemsSource = TradeData.GetWeeklyData("MSFT");
'Gets trading data'
Me.radChart.ItemsSource = TradeData.GetWeeklyData("MSFT")
8 . The final result should look like the snapshot below.
9 . The same functionality can be achieved with code-behind as well. Below is listed the equivalent procedural code.
SeriesMapping seriesMapping = new SeriesMapping();
seriesMapping.LegendLabel = "MSFT (Microsoft)";
seriesMapping.SeriesDefinition = new CandleStickSeriesDefinition();
ItemMapping itemMapping = new ItemMapping();
itemMapping.DataPointMember = DataPointMember.Open;
itemMapping.FieldName = "Open";
seriesMapping.ItemMappings.Add(itemMapping);
itemMapping = new ItemMapping();
itemMapping.DataPointMember = DataPointMember.High;
itemMapping.FieldName = "High";
seriesMapping.ItemMappings.Add(itemMapping);
itemMapping = new ItemMapping();
itemMapping.DataPointMember = DataPointMember.Low;
itemMapping.FieldName = "Low";
seriesMapping.ItemMappings.Add(itemMapping);
itemMapping = new ItemMapping();
itemMapping.DataPointMember = DataPointMember.Close;
itemMapping.FieldName = "Close";
seriesMapping.ItemMappings.Add(itemMapping);
this.radChart.SeriesMappings.Add(seriesMapping);
Dim seriesMapping As New SeriesMapping()
seriesMapping.LegendLabel = "MSFT (Microsoft)"
seriesMapping.SeriesDefinition = New CandleStickSeriesDefinition()
Dim itemMapping As New ItemMapping()
itemMapping.DataPointMember = DataPointMember.Open
itemMapping.FieldName = "Open"
seriesMapping.ItemMappings.Add(itemMapping)
itemMapping = New ItemMapping()
itemMapping.DataPointMember = DataPointMember.High
itemMapping.FieldName = "High"
seriesMapping.ItemMappings.Add(itemMapping)
itemMapping = New ItemMapping()
itemMapping.DataPointMember = DataPointMember.Low
itemMapping.FieldName = "Low"
seriesMapping.ItemMappings.Add(itemMapping)
itemMapping = New ItemMapping()
itemMapping.DataPointMember = DataPointMember.Close
itemMapping.FieldName = "Close"
seriesMapping.ItemMappings.Add(itemMapping)
Me.radChart.SeriesMappings.Add(seriesMapping)