Layout Mode
RadChart allows you to modify the layout of the X-axis to better fit the different chart types in the chart area. This will help you to improve the look and feel of your charts.
Depending on the selected layout mode, the X-Axis's ticks and labels and also the charts are visualized differently.
LayoutMode is property related only to the X-Axis, hence charts without X-Axis, like Pie and Doughnut, do not use it.
Each LayoutMode is best to be used with certain chart types:
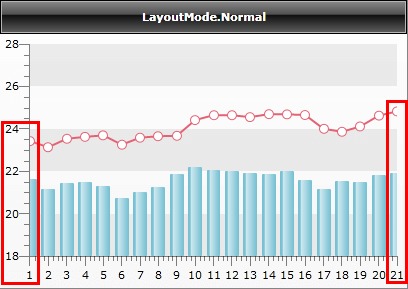
Normal - in this mode, the ticks match labels. Best for Line charts and Area charts.
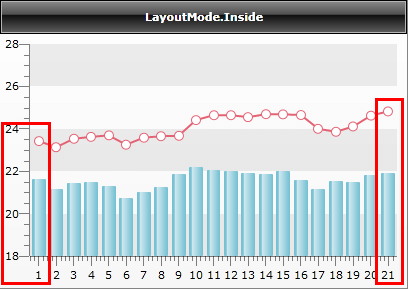
Inside - ticks match labels; a small margin on both sides is provided for better presentation. Use this for Bubble Charts, Stick and Candlestick charts.
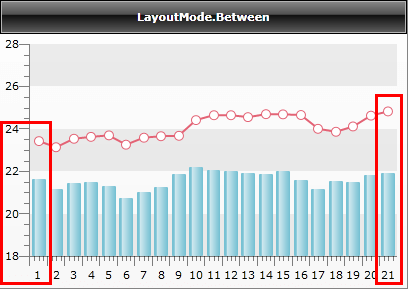
Between - ticks are margins (labels are between two ticks); a small margin on both sides is provided. Useful for Bar charts.
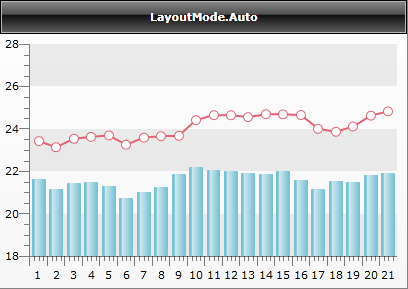
Auto - depending on the chart type, RadChart will automatically select the best LayoutMode. For multi-series charts, layout mode is prioritized in this order: Between, Inside, Normal.
You can set the LayoutMode from XAML or code-behind like this:
<telerik:RadChart x:Name="radChart">
    <telerik:RadChart.DefaultView>
        <telerik:ChartDefaultView>
            <telerik:ChartDefaultView.ChartArea>
                <telerik:ChartArea>
                    <telerik:ChartArea.AxisX>
                        <telerik:AxisX LayoutMode="Normal" />
                    </telerik:ChartArea.AxisX>
                </telerik:ChartArea>
            </telerik:ChartDefaultView.ChartArea>
        </telerik:ChartDefaultView>
    </telerik:RadChart.DefaultView>
</telerik:RadChart>
this.radChart.DefaultView.ChartArea.AxisX.LayoutMode = AxisLayoutMode.Normal;
Me.radChart.DefaultView.ChartArea.AxisX.LayoutMode = AxisLayoutMode.Normal
On the snapshots below you can see the differences between the available layout modes.
Note the areas inside the red rectangles and see how the line and the bar charts are drawn and how the X-Axis's ticks and labels are displayed for each of the modes.
LayoutMode.Normal- the chart is drawn starting directly from the first value (1), thus making the first and the last bars partly visible.

LayoutMode.Inside- the chart data is accommodated in a way that makes the first and the last bars visible by adding small offset in the beginning and in the end of the X axis.

LayoutMode.Between- in this case each item is visualized as a margin - the labels and the bars are placed between the ticks.

LayoutMode.Auto- the layout mode is set automatically to Between by following the logic specified above.
