Data Binding to ADO.NET Data Service
The purpose of this tutorial is to show you how to populate a RadChart with data from an ADO.NET Data Service in two ways:
A straight-forward way - plain method calls.
This tutorial will use the Northwind database, which can be downloaded from here.
Before proceeding further with this tutorial you need to create a new application and add a RadChart declaration in your XAML:
<telerik:RadChart x:Name="radChart" Margin="8" />
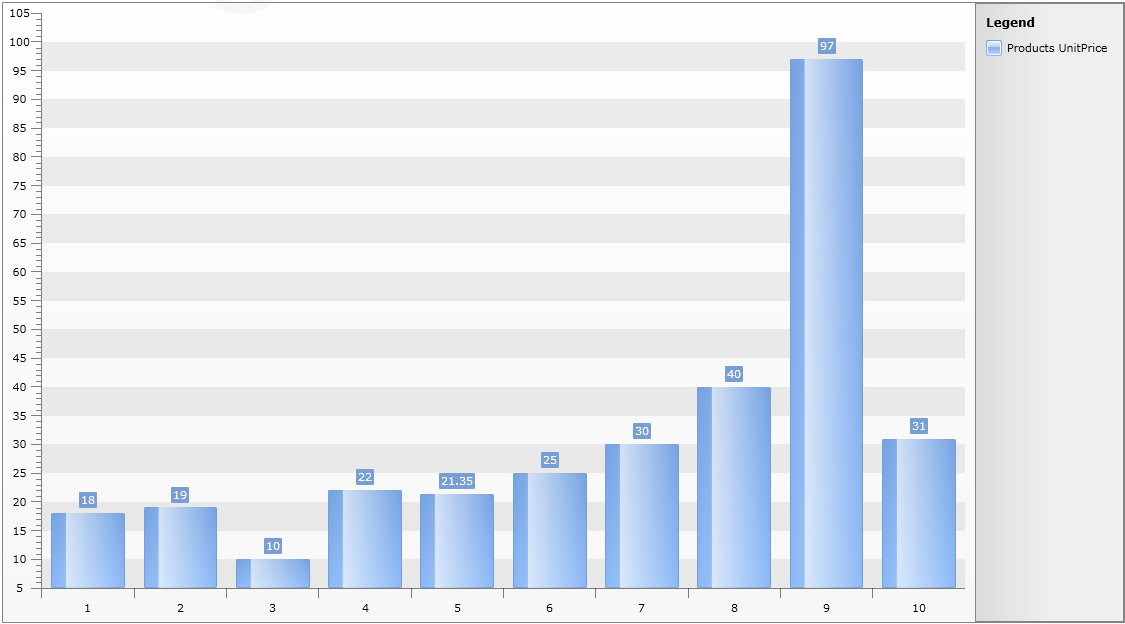
The chart control will be populated with the top 10 products from the Northwind database. On the Y axis the UnitPrice property will be displayed.
Add a new SeriesMapping to your chart declaration and set the LegendLabel property to "Products UnitPrice".
Add a new ItemMapping and set the following properties:
FieldName to UnitPrice
DataPointMember to YValue
<telerik:RadChart x:Name="radChart" Margin="8">
    <telerik:RadChart.SeriesMappings>
        <telerik:SeriesMapping LegendLabel="Products UnitPrice">
            <telerik:SeriesMapping.ItemMappings>
                <telerik:ItemMapping FieldName="UnitPrice" DataPointMember="YValue"/>
            </telerik:SeriesMapping.ItemMappings>
        </telerik:SeriesMapping>
    </telerik:RadChart.SeriesMappings>
</telerik:RadChart>
- Create new Business Object and name it ProductDetail:
public class ProductDetail
    {
        public decimal? UnitPrice { get; set; }

        public ProductDetail(decimal? unitPrice)
        {
            this.UnitPrice = unitPrice;
        }
    }
Public Class ProductDetail
    Public Property UnitPrice() As Decimal?
    Public Sub New(ByVal unitPrice? As Decimal)
        Me.UnitPrice = unitPrice
    End Sub
End Class
Plain Method Calls
Add a reference to your ADO.NET Data Service.
- Switch to the code-behind and add a reference to the NorthWindEntities object__DataServiceContext__.
dbContext = new DataServiceContext(new Uri("SampleAdoNetDataService.svc", UriKind.Relative));
Dim dbContext As New DataServiceContext(New Uri("SampleAdoNetDataService.svc", UriKind.Relative))
NorthwindEntities dbContext = new NorthwindEntities(new Uri("Enter your service address here"));
Dim dbContext As New NorthwindEntities(New Uri("Enter your service address here"))
For more information about how to add a reference to an ADO.NET Data Service and how to create a new instance of the exposed entity, take a look at the Consuming ADO.NET Data Service topic.
Add the following code which will make the initial load of the objects.
private void BeginRequest()
{
    DataServiceQuery<Products> query = dbContext.CreateQuery<Products>( "Products" );
    query.BeginExecute(ProductsRequestCompleted, query);
}

private void ProductsRequestCompleted(IAsyncResult asyncResult)
  {
    DataServiceQuery<Products> query = asyncResult.AsyncState as DataServiceQuery<Products>;
    products = query.EndExecute(asyncResult).ToList();
    List<ProductDetail> result = new List<ProductDetail>();
  foreach (Products p in products.Take(10))
   {
    result.Add(new ProductDetail(p.UnitPrice));
   }
   RadChart1.ItemsSource = result;
 }
Private Sub BeginRequest()
    Dim query As DataServiceQuery(Of Products) = dbContext.CreateQuery(Of Products)("Products")
    query.BeginExecute(AddressOf ProductsRequestCompleted, query)
End Sub

Private Sub ProductsRequestCompleted(ByVal asyncResult As IAsyncResult)
    Dim query As DataServiceQuery(Of Products) = TryCast(asyncResult.AsyncState, DataServiceQuery(Of Products))
    Products = query.EndExecute(asyncResult)
    Dim result As New List(Of ProductDetail)()

    For Each p As Products In Products.Take(10)
        result.Add(New ProductDetail(p.UnitPrice))
    Next p
    RadChart1.ItemsSource = result
End Sub
this.radChart.ItemsSource = dbContext.Products.Execute().Take(10).ToList();
Me.radChart.ItemsSource = dbContext.Products.Execute().Take(10).ToList()
Run your demo, the result can be seen on the next image:
Using MVVM Approach
This section will show you how to populate your RadChart control in a MVVM manner.
- Create a new class named NorthwindDataSource.
public class NorthwindDataSource
{
}
Public Class NorthwindDataSource
End Class
Add a reference to your ADO.NET Data Service.
In the NorthwindDataSource class add a reference to an ObservableCollection of Categories.
In the NorthwindDataSource class add a reference to the NorthwindEntities object.
public class NorthwindDataSource
{
    private static NorthwindEntities northwindEntity;
    public NorthwindDataSource()
    {
        northwindEntity = new NorthwindEntities( new Uri( "SampleAdoNetDataService.svc", UriKind.Relative ) );
        this.Products = new ObservableCollection<Products>();
    }
    public ObservableCollection<Products> Products
    {
        get;
        set;
    }
}
Public Class NorthwindDataSource
    Private Shared northwindEntity As NorthwindEntities

    Public Sub New()
        northwindEntity = New NorthwindEntities(New Uri("SampleAdoNetDataService.svc", UriKind.Relative))
        Me.Products = New ObservableCollection(Of Products)()
    End Sub

    Private _Products As ObservableCollection(Of Products)
    Public Property Products() As ObservableCollection(Of Products)
        Get
            Return _Products
        End Get
        Set(ByVal value As ObservableCollection(Of Products))
            _Products = value
        End Set
    End Property
End Class
- Add the following code in the constructor of the NorthwindDataSource. It will make the initial load of all Categories from the database:
var query = ( from p in northwindEntity.Products
              select p ).Take( 10 );
DataServiceQuery<Products> products = ( DataServiceQuery<Products> )query;
products.BeginExecute((IAsyncResult result) => EntitiesLoaded<Products>(result, this.Products ), products );

foreach ( Products p in query.ToList() )
{
    this.Products.Add( p );
}
Dim query = (From p In northwindEntity.Products _
    Select p).Take(10)
Dim products As DataServiceQuery(Of Products) = DirectCast(query, DataServiceQuery(Of Products))
products.BeginExecute(Sub(result As IAsyncResult) EntitiesLoaded(Of Products)(result, Me.Products), products)
For Each p As Products In query.ToList()
    Me.Products.Add(p)
Next
private static void EntitiesLoaded<T>(IAsyncResult result, Collection<T> entities)
{
    DataServiceQuery<T> query = result.AsyncState as DataServiceQuery<T>;
    foreach (T entity in query.EndExecute(result))
    {
        entities.Add(entity);
    }
}
Private Shared Sub EntitiesLoaded(Of T)(ByVal result As IAsyncResult, ByVal entities As Collection(Of T))
    Dim query As DataServiceQuery(Of T) = TryCast(result.AsyncState, DataServiceQuery(Of T))
    For Each entity As T In query.EndExecute(result)
        entities.Add(entity)
    Next
End Sub
- Declare the NorthwindDataSource object as a resource in your application.
<UserControl.Resources>
    <example:NorthwindDataSource x:Key="DataSource"/>
</UserControl.Resources>
- Update your chart declaration - set the ItemsSource property.
<telerik:RadChart x:Name="radChart" Margin="8"
                  ItemsSource="{Binding Source={StaticResource DataSource}, Path=Products}">
    <telerik:RadChart.SeriesMappings>
        <telerik:SeriesMapping LegendLabel="Products UnitPrice">
            <telerik:SeriesMapping.ItemMappings>
                <telerik:ItemMapping FieldName="UnitPrice" DataPointMember="YValue"/>
            </telerik:SeriesMapping.ItemMappings>
        </telerik:SeriesMapping>
    </telerik:RadChart.SeriesMappings>
</telerik:RadChart>
Here it is shown how the final result should look like: