Data Binding to Many Chart Areas
RadChart's DefaultView provides you with layout that consists of Chart Title, Chart Area and Chart Legend. However, in some cases, you might need to have more than one ChartArea in order to display two or more charts separately. Of course, you will also need to use data binding via SeriesMapping/ItemMapping in order to populate the RadChart with data.
When you have multiple ChartAreas, for each series you can specify which chart area to be used to display the series. To do that, in XAML, use the SeriesMapping.ChartAreaName property and specify the name of the ChartArea you want to be used for that series. Alternatively, you can specify the ChartArea in the code behind by using SeriesMapping.ChartArea property - simply set it to the desired ChartArea instance.
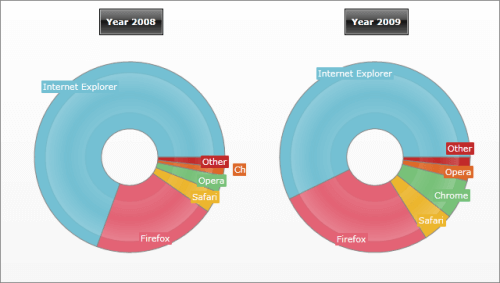
The example below demonstrates how to bind two series to two different ChartAreas. Which means that you cannot use the DefaultView, so you will have to first set RadChart.UseDefaultView to False. Then, add a Grid with two rows and two columns. On the first row add one ChartTitle for each of the columns. On the second row add two ChartAreas. Give a name to each ChartArea and it will be used later to bind series to a chart area: "webBrowsersShare2008Chart" and "webBrowsersShare2009Chart" respectively.
The last step is to bind the data via SeriesMapping/ItemMapping. For each series, set the ChartAreaName to the name of the previously defined ChartArea:
<telerik:RadChart x:Name="radChart" UseDefaultLayout="False">
    <Grid Margin="10,10,0,20">
        <Grid.RowDefinitions>
            <RowDefinition Height="Auto" />
            <RowDefinition Height="" />
        </Grid.RowDefinitions>
        <Grid.ColumnDefinitions>
            <ColumnDefinition Width="" />
            <ColumnDefinition Width="*" />
        </Grid.ColumnDefinitions>
        <telerik:ChartTitle Grid.Row="0" Grid.Column="0"
                            Margin="0,0,0,10" HorizontalAlignment="Center"
                            Content="Year 2008" />
        <telerik:ChartTitle Grid.Row="0" Grid.Column="1"
                            Margin="0,0,0,10" HorizontalAlignment="Center"
                            Content="Year 2009" />
        <telerik:ChartArea x:Name="webBrowsersShare2008Chart" Grid.Row="1" Grid.Column="0" />
        <telerik:ChartArea x:Name="webBrowsersShare2009Chart" Grid.Row="1"
                           Grid.Column="1" Margin="0,0,0,15" />
    </Grid>

    <telerik:RadChart.SeriesMappings>
        <telerik:SeriesMapping ChartAreaName="webBrowsersShare2008Chart" CollectionIndex="0">
            <telerik:SeriesMapping.SeriesDefinition>
                <telerik:DoughnutSeriesDefinition />
            </telerik:SeriesMapping.SeriesDefinition>

            <telerik:SeriesMapping.ItemMappings>
                <telerik:ItemMapping DataPointMember="YValue" FieldName="Value" />
                <telerik:ItemMapping DataPointMember="Label" FieldName="Description" />
            </telerik:SeriesMapping.ItemMappings>
        </telerik:SeriesMapping>
        <telerik:SeriesMapping ChartAreaName="webBrowsersShare2009Chart" CollectionIndex="1">
            <telerik:SeriesMapping.SeriesDefinition>
                <telerik:DoughnutSeriesDefinition />
            </telerik:SeriesMapping.SeriesDefinition>
            <telerik:SeriesMapping.ItemMappings>
                <telerik:ItemMapping DataPointMember="YValue" FieldName="Value" />
                <telerik:ItemMapping DataPointMember="Label" FieldName="Description" />
            </telerik:SeriesMapping.ItemMappings>
        </telerik:SeriesMapping>
    </telerik:RadChart.SeriesMappings>
</telerik:RadChart>
//Creating new instance of RadChart control
Telerik.Windows.Controls.RadChart radChart = new Telerik.Windows.Controls.RadChart();
radChart.UseDefaultLayout = false;
//....
//Creating Grid with two rows and two columns to host two ChartTitles and two ChartAreas
Grid chartLayout = new Grid();
chartLayout.Margin = new Thickness( 10, 10, 0, 20 );
chartLayout.RowDefinitions.Add( new RowDefinition() );
chartLayout.RowDefinitions[ 0 ].Height = new GridLength( 0, GridUnitType.Auto );
chartLayout.RowDefinitions.Add( new RowDefinition() );
radChart.Content = chartLayout;
chartLayout.ColumnDefinitions.Add( new ColumnDefinition() );
chartLayout.ColumnDefinitions.Add( new ColumnDefinition() );
//Creating ChartTitle for the left chart
Telerik.Windows.Controls.Charting.ChartTitle chartTitle = new Telerik.Windows.Controls.Charting.ChartTitle();
chartTitle.Margin = new Thickness( 0, 0, 0, 10 );
chartTitle.HorizontalAlignment = HorizontalAlignment.Center;
chartTitle.Content = "Year 2008";
chartLayout.Children.Add( chartTitle );
//Creating ChartArea of for the left chart
Telerik.Windows.Controls.Charting.ChartArea chartArea1 = new Telerik.Windows.Controls.Charting.ChartArea();
chartArea1.Name = "webBrowsersShare2008Chart";
chartLayout.Children.Add( chartArea1 );
Grid.SetRow( chartArea1, 1 );
//Creating ChartTitle for the right chart
chartTitle = new Telerik.Windows.Controls.Charting.ChartTitle();
chartTitle.Margin = new Thickness( 0, 0, 0, 10 );
chartTitle.HorizontalAlignment = HorizontalAlignment.Center;
chartTitle.Content = "Year 2009";
chartLayout.Children.Add( chartTitle );
Grid.SetColumn( chartTitle, 1 );
//Creating ChartArea of for the right chart
Telerik.Windows.Controls.Charting.ChartArea chartArea2 = new Telerik.Windows.Controls.Charting.ChartArea();
chartArea2 = new Telerik.Windows.Controls.Charting.ChartArea();
chartArea2.Name = "webBrowsersShare2009Chart";
chartLayout.Children.Add( chartArea2 );
Grid.SetRow( chartArea2, 1 );
Grid.SetColumn( chartArea2, 1 );
//Creating series mapping for the first chart and link it to the left ChartArea
SeriesMapping seriesMapping = new SeriesMapping();
seriesMapping.CollectionIndex = 0;
seriesMapping.ChartAreaName = "webBrowsersShare2008Chart";
seriesMapping.SeriesDefinition = new DoughnutSeriesDefinition();
seriesMapping.ItemMappings.Add( new ItemMapping( "Value", DataPointMember.YValue ) );
seriesMapping.ItemMappings.Add( new ItemMapping( "Description", DataPointMember.Label ) );
radChart.SeriesMappings.Add( seriesMapping );
//Creating series mapping for the first chart and link it to the right ChartArea
seriesMapping = new SeriesMapping();
seriesMapping.CollectionIndex = 1;
seriesMapping.ChartAreaName = "webBrowsersShare2009Chart";
seriesMapping.SeriesDefinition = new DoughnutSeriesDefinition();
seriesMapping.ItemMappings.Add( new ItemMapping( "Value", DataPointMember.YValue ) );
seriesMapping.ItemMappings.Add( new ItemMapping( "Description", DataPointMember.Label ) );
radChart.SeriesMappings.Add( seriesMapping );
//....
'Creating new instance of RadChart control'
Dim radChart As New Telerik.Windows.Controls.RadChart()
'....'
'Creating Grid with two rows and two columns to host two ChartTitles and two ChartAreas'
Dim chartLayout As New Grid()
chartLayout.Margin = New Thickness(10, 10, 0, 20)
chartLayout.RowDefinitions.Add(New RowDefinition())
chartLayout.RowDefinitions(0).Height = New GridLength(0, GridUnitType.Auto)
chartLayout.RowDefinitions.Add(New RowDefinition())
radChart.Content = chartLayout
chartLayout.ColumnDefinitions.Add(New ColumnDefinition())
chartLayout.ColumnDefinitions.Add(New ColumnDefinition())
'Creating ChartTitle for the left chart'
Dim chartTitle As New Telerik.Windows.Controls.Charting.ChartTitle()
chartTitle.Margin = New Thickness(0, 0, 0, 10)
chartTitle.HorizontalAlignment = HorizontalAlignment.Center
chartTitle.Content = "Year 2008"
chartLayout.Children.Add(chartTitle)
'Creating ChartArea of for the left chart'
Dim chartArea1 As New Telerik.Windows.Controls.Charting.ChartArea()
chartArea1.Name = "webBrowsersShare2008Chart"
chartLayout.Children.Add(chartArea1)
Grid.SetRow(chartArea1, 1)
'Creating ChartTitle for the right chart'
chartTitle = New Telerik.Windows.Controls.Charting.ChartTitle()
chartTitle.Margin = New Thickness(0, 0, 0, 10)
chartTitle.HorizontalAlignment = HorizontalAlignment.Center
chartTitle.Content = "Year 2009"
chartLayout.Children.Add(chartTitle)
Grid.SetColumn(chartTitle, 1)
'Creating ChartArea of for the right chart'
Dim chartArea2 As New Telerik.Windows.Controls.Charting.ChartArea()
chartArea2 = New Telerik.Windows.Controls.Charting.ChartArea()
chartArea2.Name = "webBrowsersShare2009Chart"
chartLayout.Children.Add(chartArea2)
Grid.SetRow(chartArea2, 1)
Grid.SetColumn(chartArea2, 1)
'Creating series mapping for the first chart and link it to the left ChartArea'
Dim seriesMapping As New SeriesMapping()
seriesMapping.CollectionIndex = 0
seriesMapping.ChartAreaName = "webBrowsersShare2008Chart"
seriesMapping.SeriesDefinition = New DoughnutSeriesDefinition()
seriesMapping.ItemMappings.Add(New ItemMapping("Value", DataPointMember.YValue))
seriesMapping.ItemMappings.Add(New ItemMapping("Description", DataPointMember.Label))
radChart.SeriesMappings.Add(seriesMapping)
'Creating series mapping for the first chart and link it to the right ChartArea'
seriesMapping = New SeriesMapping()
seriesMapping.CollectionIndex = 1
seriesMapping.ChartAreaName = "webBrowsersShare2009Chart"
seriesMapping.SeriesDefinition = New DoughnutSeriesDefinition()
seriesMapping.ItemMappings.Add(New ItemMapping("Value", DataPointMember.YValue))
seriesMapping.ItemMappings.Add(New ItemMapping("Description", DataPointMember.Label))
radChart.SeriesMappings.Add(seriesMapping)
'....'
As you can see from the image below, the RadChart layout is changed and contains two ChartAreas - for year 2008 and for year 2009. Two series are created and for each one of them CharAreaName property is set to the appropriate ChartArea. Thus, the data for year 2008 goes to the left ChartArea while the data for 2009 goes to the right ChartArea. Another option is to use SeriesMapping.AreaName from the code behind to set the desired instance of the ChartArea directly: