Getting Started with WinUI HeatMap
This guide provides the information you need to start using the Telerik UI for WinUI HeatMap by adding the component to your project.
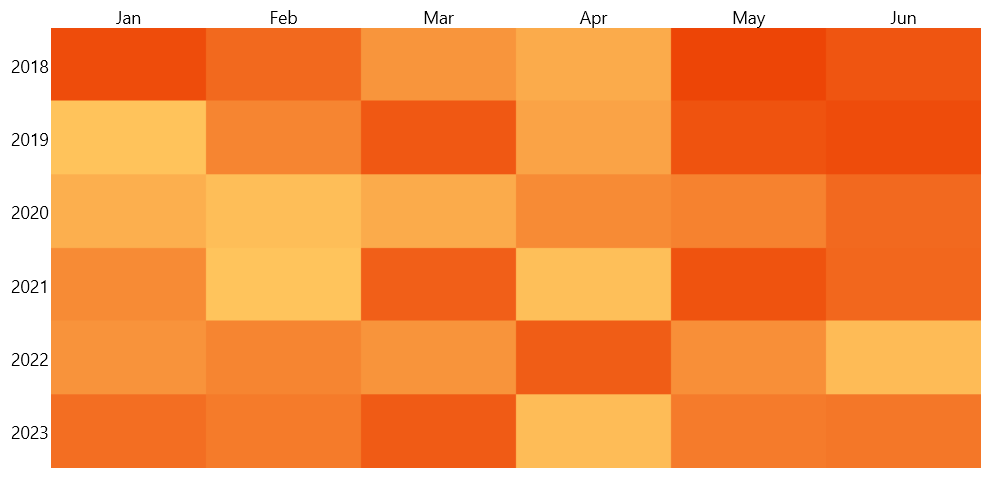
At the end, you will be able to achieve the following result.
Prerequisites
Before adding the HeatMap, you need to:
-
Create your Telerik UI for WinUI application and install the Telerik UI for WinUI components depending on the required installation approach:
Merge the
Generic.xamlResourceDictionary inApp.xaml.
Add the required HeatMap styles
<Application.Resources>
    <ResourceDictionary>
        <ResourceDictionary.MergedDictionaries>
            <XamlControlsResources xmlns="using:Microsoft.UI.Xaml.Controls" />
            <ResourceDictionary Source="ms-appx:///Telerik.WinUI.Controls/Themes/Generic.xaml"/>
            <!-- Other merged dictionaries here -->
        </ResourceDictionary.MergedDictionaries>
        <!-- Other app resources here -->
    </ResourceDictionary>
</Application.Resources>
Add the Assembly References
To use the RadHeatMap component, add references to Telerik.WinUI.Controls.dll and Telerik.Licensing.Runtime.dll.
Set Up the Data
To use the HeatMap control, you have to define a model to describe the data that will be shown.
Define the model
public class TempInfo
{
    public int Year { get; set; }
    public string Month { get; set; }
    public double Temperature { get; set; }
}
Set Up the HeatMap
The control works with few different definitions that describe how to data will be shown. The following example uses the CategoricalDefinition. The definition provides a few properties to define what data will be used.
The RowGroupMemberPath contains the name of the property in the custom model that will be used to generate the rows.
The ColumnGroupMemberPath contains the name of the property in the custom model that will be used to generate the columns. The ValuePath contains the name of the property in the custom model that will be used to generate the cells. Based on that value, the cell will be colored differently.
To populate the control with data, use its ItemsSource property.
Define the HeatMap
<telerik:RadHeatMap xmlns:telerik="using:Telerik.UI.Xaml.Controls.DataVisualization">
    <telerik:RadHeatMap.Definition>
        <telerik:CategoricalDefinition x:Name="categoricalDefinition"
                                       RowGroupMemberPath="Year"
                                       ColumnGroupMemberPath="Month"
                                       ValuePath="Temperature" />
    </telerik:RadHeatMap.Definition>
</telerik:RadHeatMap>
Create the data and set the ItemsSource
int year = 2018;
string[] months = new string[6] { "Jan", "Feb", "Mar", "Apr", "May", "Jun" };
var randomNumberGenerator = new Random();

var source = new ObservableCollection<TempInfo>();
for (int i = 0; i < months.Length; i++)
{
    for (int k = 0; k < 6; k++)
    {
        var info = new TempInfo() { Year = year + k, Month = months[i], Temperature = randomNumberGenerator.Next(10, 300) };
        source.Add(info);
    }
}

this.categoricalDefinition.ItemsSource = source;
Colorize the HeatMap
For the purposes of this guide, the HeatMap uses its built-in colorizer which sets the color of each cell based on the plotted value. However, you can change the colors as you like by defining a new colorizer.
Telerik UI for WinUI Learning Resources
- Telerik UI for WinUI HeatMap Component
- Getting Started with Telerik UI for WinUI Components
- Telerik UI for WinUI Installation
- Telerik UI for WinUI Examples
- Telerik UI for WinUI Accessibility
- Telerik UI for WinUI License Agreement