Data Population
To populate the HeatMap with data, you have to first set up the Model and ViewModel, and then configure the vertical or categorical definition.
Setting Up the Model and ViewModel
The following example demonstrates how to create a sample object to hold temperature information, and a ViewModel that holds a collection of those objects.
Set up the Model and ViewModel
public class TempInfo
{
    public DateTime Year { get; set; }
    public string Month { get; set; }
    public double Temperature { get; set; }
    public double Rain { get; set; }
}

public class ViewModel
{
    private ObservableCollection<TempInfo> tempInfos;

    public ObservableCollection<TempInfo> TempInfos
    {
        get
        {
            if(this.tempInfos == null)
            {
                this.tempInfos = this.GenerateTempInfos();
            }

            return this.tempInfos;
        }
    }

    private ObservableCollection<TempInfo> GenerateTempInfos()
    {
        DateTime date = DateTime.Today;
        var infos = new ObservableCollection<TempInfo>()
        {
            new TempInfo() { Year = date, Month = "Jan", Temperature = 17, Rain = 8.8},
            new TempInfo() { Year = date, Month = "Feb", Temperature = 20, Rain = 6.25},
            new TempInfo() { Year = date, Month = "Mar", Temperature = 18, Rain = 7.4},

            new TempInfo() { Year = date.AddYears(1), Month = "Jan", Temperature = 5, Rain=10.3},
            new TempInfo() { Year = date.AddYears(1), Month = "Feb", Temperature = 13, Rain = 9.8},
            new TempInfo() { Year = date.AddYears(1), Month = "Mar", Temperature = 21, Rain = 9.6},

            new TempInfo() { Year = date.AddYears(2), Month = "Jan", Temperature = 14, Rain = 11.5},
            new TempInfo() { Year = date.AddYears(2), Month = "Feb", Temperature = 19, Rain = 7.5},
            new TempInfo() { Year = date.AddYears(2), Month = "Mar", Temperature = 17, Rain = 10.1},
        };

        return infos;
    }
}
Categorical Definition
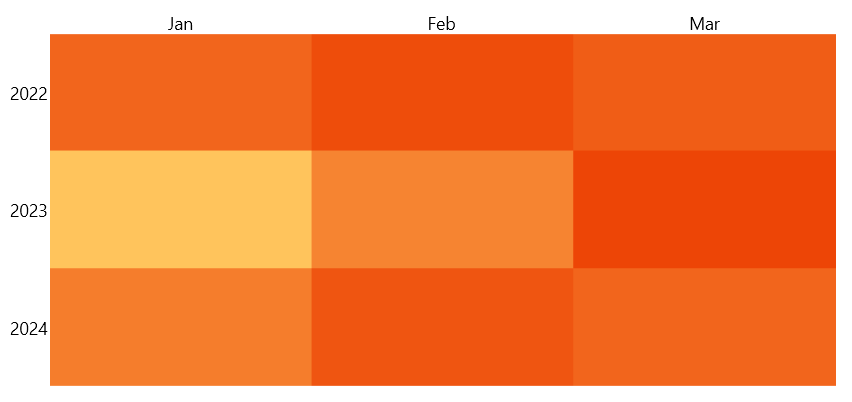
To visualize the data, you need to set the Definition property of the HeatMap. The following example demonstrates how to set it to a CategoricalDefinition.
Configure the definition to a CategoricalDefinition
<Grid>
    <Grid.DataContext>
        <local:ViewModel />
    </Grid.DataContext>

    <telerik:RadHeatMap Height="300">
        <telerik:RadHeatMap.Definition>
            <telerik:CategoricalDefinition ItemsSource="{Binding TempInfos}"
                                           RowGroupMemberPath="Year"
                                           ColumnGroupMemberPath="Month"
                                           ValuePath="Temperature" />
        </telerik:RadHeatMap.Definition>
        <telerik:RadHeatMap.RowHeaderSettings>
            <telerik:HeatMapRowHeaderSettings LabelFormat="yyyy"/>
        </telerik:RadHeatMap.RowHeaderSettings>
    </telerik:RadHeatMap>
</Grid>
Vertical Definition
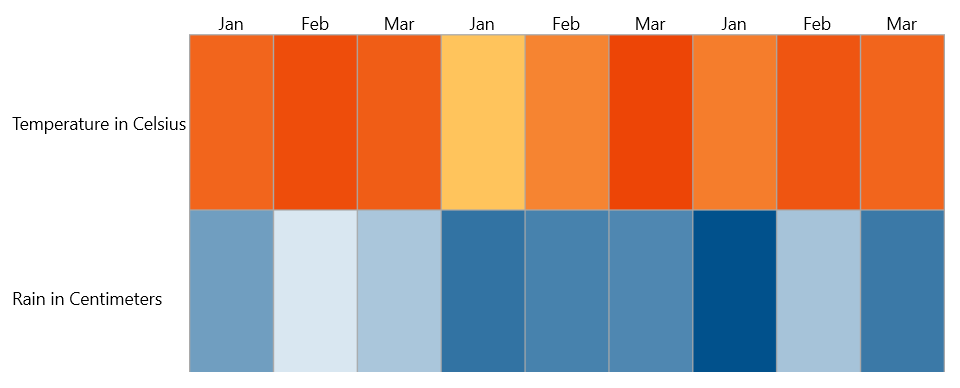
Alternatively, you can also use a VerticalDefinition.
The following example demonstrates how to set the months as the HeaderPath of the HeatMap. Thus, the months supplied by the Month property of the underlying source, will be visualized as column headers. For each row, you'll display the Temperature and Rain values of the corresponding month. You can also use the same code to declare a HorizontalDefinition.
Configure the definition to a VerticalDefinition
<Grid>
    <Grid.DataContext>
        <local:ViewModel />
    </Grid.DataContext>
    <Grid.Resources>
        <telerik:HeatMapValueGradientColorizer x:Key="RainColorizer">
            <GradientStop Offset="0" Color="#D9E7F1" />
            <GradientStop Offset="1" Color="#01518C" />
        </telerik:HeatMapValueGradientColorizer>
    </Grid.Resources>

    <telerik:RadHeatMap ShowToolTips="True"
                        Height="300"
                        CellBorderColor="DarkGray"
                        CellBorderThickness="1">
        <telerik:RadHeatMap.Definition>
            <telerik:VerticalDefinition ItemsSource="{Binding TempInfos}"
                                        HeaderPath="Month">
                <telerik:VerticalDefinition.MemberMappings>
                    <telerik:MemberMapping Header="Temperature in Celsius"
                                           ValuePath="Temperature"/>
                    <telerik:MemberMapping Header="Rain in Centimeters"
                                           ValuePath="Rain"
                                           Colorizer="{StaticResource RainColorizer}"/>
                </telerik:VerticalDefinition.MemberMappings>
            </telerik:VerticalDefinition>
        </telerik:RadHeatMap.Definition>
    </telerik:RadHeatMap>
</Grid>
A HeatMap with a VerticalDefinition
For a runnable project, refer to the WPF Samples GitHub repository.