Colorizers
The HeatMap provides a built-in colorizer which defines the color of each cell based on the plotted value. You can also change the colors as required by defining a new colorizer.
Horizontal/Vertical Definition Colorizers
In horizontal or vertical definitions, the colorizer is defined in the MemberMappings of the corresponding definition—for the horizontal definition, each item gets a row; for the vertical definition, each items gets a column.
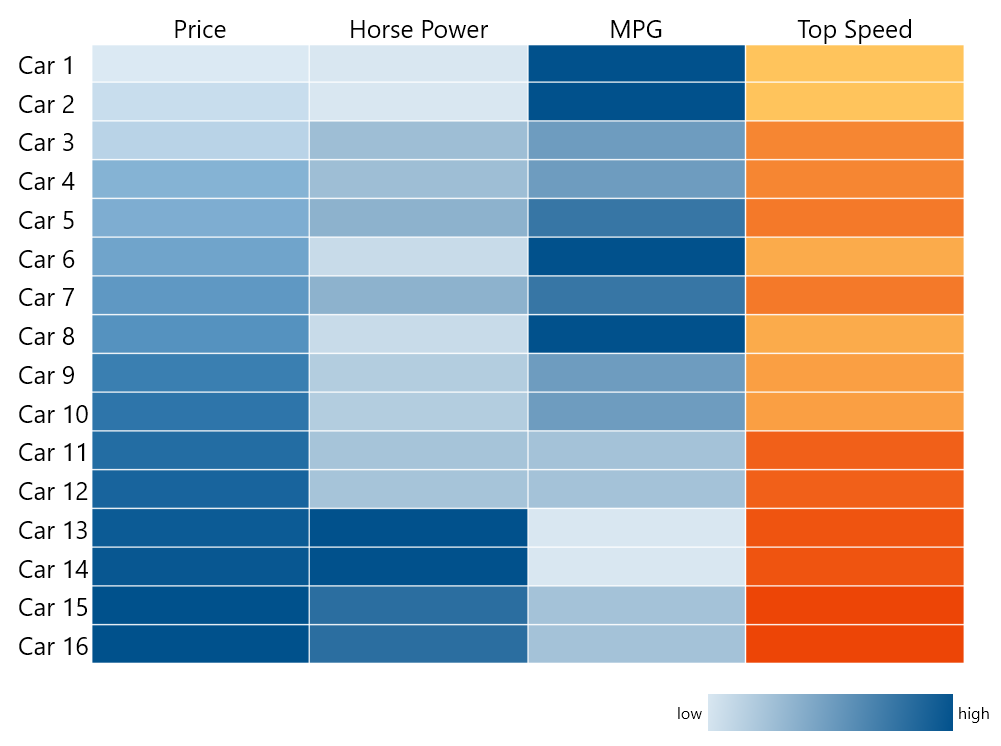
The following example demonstrates sample data that will be used to populate the HeatMap. The legend after the HeatMap is placed for later use in this article.
Define the model
public class Car
{
    public string Name { get; set; }
    public int MilesPerGallon { get; set; }
    public int TopSpeed { get; set; }
    public int Price { get; set; }
    public int HorsePower { get; set; }
}
Populate the HeatMap
var cars = new List<Car>()
{
    new Car() {Name = "Car 1", Price = 20590, HorsePower = 70,  MilesPerGallon = 37, TopSpeed = 60 },
    new Car() {Name = "Car 2", Price = 21990, HorsePower = 70,  MilesPerGallon = 37, TopSpeed = 60 },
    new Car() {Name = "Car 3", Price = 23200, HorsePower = 140, MilesPerGallon = 28, TopSpeed = 110 },
    new Car() {Name = "Car 4", Price = 27500, HorsePower = 140, MilesPerGallon = 28, TopSpeed = 110 },
    new Car() {Name = "Car 5", Price = 28200, HorsePower = 160, MilesPerGallon = 31, TopSpeed = 120 },
    new Car() {Name = "Car 6", Price = 29500, HorsePower = 90,  MilesPerGallon = 35, TopSpeed = 80 },
    new Car() {Name = "Car 7", Price = 31200, HorsePower = 160, MilesPerGallon = 31, TopSpeed = 120 },
    new Car() {Name = "Car 8", Price = 32200, HorsePower = 90,  MilesPerGallon = 35, TopSpeed = 80 },
    new Car() {Name = "Car 9", Price = 35200, HorsePower = 115, MilesPerGallon = 29, TopSpeed = 90 },
    new Car() {Name = "Car 10", Price = 36700, HorsePower = 115, MilesPerGallon = 29, TopSpeed = 90 },
    new Car() {Name = "Car 11", Price = 38200, HorsePower = 130, MilesPerGallon = 24, TopSpeed = 140 },
    new Car() {Name = "Car 12", Price = 39700, HorsePower = 130, MilesPerGallon = 24, TopSpeed = 140 },
    new Car() {Name = "Car 13", Price = 41500, HorsePower = 326, MilesPerGallon = 16, TopSpeed = 150 },
    new Car() {Name = "Car 14", Price = 42200, HorsePower = 326, MilesPerGallon = 16, TopSpeed = 150 },
    new Car() {Name = "Car 15", Price = 43500, HorsePower = 276, MilesPerGallon = 25, TopSpeed = 162 },
    new Car() {Name = "Car 16", Price = 43500, HorsePower = 276, MilesPerGallon = 25, TopSpeed = 162 },
};

this.radHeatMap.Definition.ItemsSource = cars;
<Grid x:Name="LayoutRoot" Background="White" Width="800" Height="600">
    <Grid.RowDefinitions>
        <RowDefinition Height="15*"/>
        <RowDefinition Height="*"/>
    </Grid.RowDefinitions>

    <telerik:RadHeatMap x:Name="radHeatMap" ShowToolTips="True" CellBorderThickness="1" FontSize="20">
        <telerik:RadHeatMap.Definition>
            <telerik:HorizontalDefinition HeaderPath="Name">
                <telerik:MemberMapping Header="Price" ValuePath="Price"/>
                <telerik:MemberMapping Header="Horse Power" ValuePath="HorsePower"/>
                <telerik:MemberMapping Header="MPG" ValuePath="MilesPerGallon"/>
                <telerik:MemberMapping Header="Top Speed" ValuePath="TopSpeed" />
            </telerik:HorizontalDefinition>
        </telerik:RadHeatMap.Definition>
    </telerik:RadHeatMap>

    <Grid Grid.Row="1" Width="250" HorizontalAlignment="Right">
        <Grid.ColumnDefinitions>
            <ColumnDefinition Width="Auto" />
            <ColumnDefinition />
            <ColumnDefinition Width="Auto" />
        </Grid.ColumnDefinitions>
        <TextBlock Grid.Column="0" Text="low" VerticalAlignment="Center" FontSize="13" />
        <TextBlock Grid.Column="2" Text="high" VerticalAlignment="Center" FontSize="13" />
        <Border Grid.Column="1" Margin="4">
            <Border.Background>
                <LinearGradientBrush>
                    <GradientStop Offset="0.0" Color="#D9E7F1"/>
                    <GradientStop Offset="0.25" Color="#A4C2D8"/>
                    <GradientStop Offset="0.5" Color="#6E9CBF"/>
                    <GradientStop Offset="0.75" Color="#3776A5"/>
                    <GradientStop Offset="1.0" Color="#01518C"/>
                </LinearGradientBrush>
            </Border.Background>
        </Border>

    </Grid>
</Grid>
The following image shows the result.
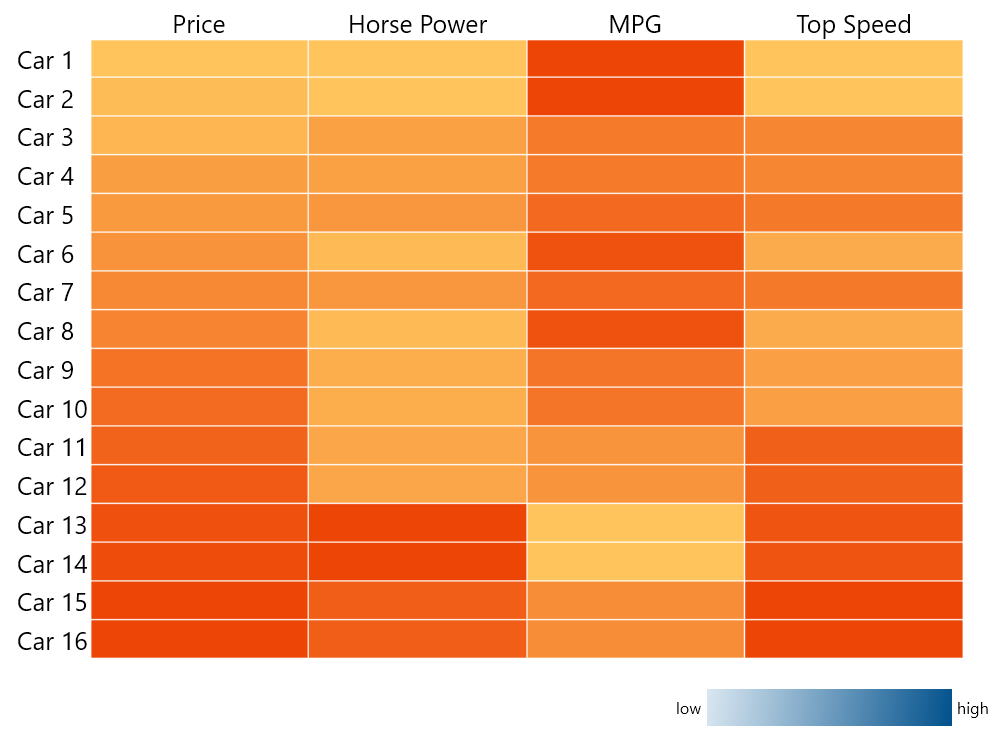
Built-In Gradient Colorizer
The previous example doesn't explicitly set a colorizer. When no colorizer is specified, the HeatMap uses its default HeatMapValueGradientColorizer.
The built-in HeatMapValueGradientColorizer contains a set of GradientStops and applies a color according to the values of the HeatMap items and the gradient stops of the colorizer itself.
Depending on the IsAbsolute property value, each GradientStop.Offset value can be absolute or relative:
A colorizer is relative when
IsAbsoluteisfalse, which is its default value. In the relative mode, the colorizer scans all values to find the smallest and greatest ones. In the same manner, these two correspond toGradientStop.Offsets0and1. Also, by setting theRangeMinimumandRangeMaximumproperties, you are specifying the actual minimum and maximum values, that is, you are defining the values to correspond to offsets 0 and 1.In the absolute colorizer mode, the offsets are set to the actual values which are expected for the items in the HeatMap.
When the same instance of any relative colorizer is applied to more than one row or column, the colorizer shares the minimum and maximum values between all the assigned rows or columns.
The following example demonstrates how to define a HeatMapValueGradientColorizer. Note that when a value is smaller than the already set RangeMinimum or greater that the already set RangeMaximum, it gets that color. The same goes for all types of colorizers.
Define a HeatMapValueGradientColorizer in code
HeatMapValueGradientColorizer valueGradientColorizer = new HeatMapValueGradientColorizer();
valueGradientColorizer.GradientStops.Add(new GradientStop() { Color = new Color() { R = 217, G = 231, B = 241, A = 255}, Offset = 0 });
valueGradientColorizer.GradientStops.Add(new GradientStop() { Color = new Color() { R = 1, G = 81, B = 140, A = 255 }, Offset = 1 });
HorsePowerMemberMapping.Colorizer = valueGradientColorizer;
Define a HeatMapValueGradientColorizer in XAML
<Grid.Resources>
    <telerik:HeatMapValueGradientColorizer x:Key="ValueGradientColorizer">
        <GradientStop Offset="0" Color="#D9E7F1" />
        <GradientStop Offset="1" Color="#01518C" />
    </telerik:HeatMapValueGradientColorizer>
</Grid.Resources>
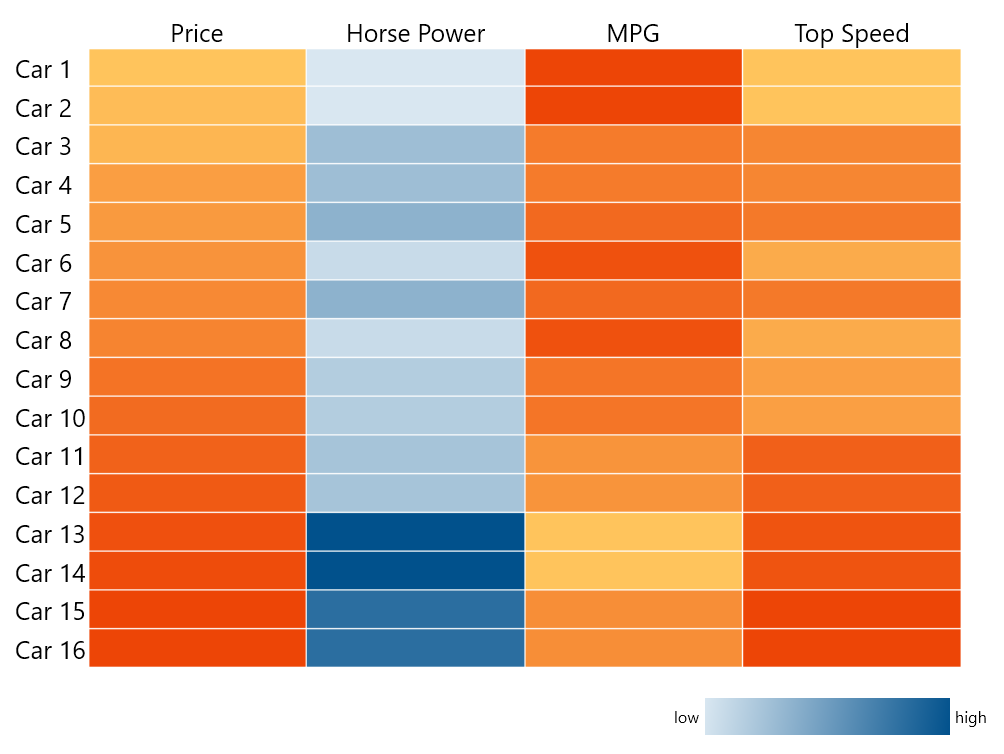
The following example demonstrates how to apply a colorizer to the already defined Horse Power MemberMapping:
Set the Colorizer of the MemberMapping
<telerik:MemberMapping x:Name="HorsePowerMemberMapping" Header="Horse Power" ValuePath="HorsePower" Colorizer="{StaticResource ValueGradientColorizer}"/>
0 is 70, and to offset 1 – 326.
Range Colorizer
The HeatMapRangeColorizer uses a set of colors, each corresponding to a range. Similarly to the HeatMapValueGradientColorizer, the HeatMapRangeColorizer can work in an absolute and relative mode.
In absolute mode, the range is specified in actual values, the ones expected for the items to have.
In relative mode, the range is always between 0 and 1. The
HeatMapRangeColorizerhas no property which corresponds to theRangeMinimumandRangeMaximum, and the colorizer always looks for the smallest and greatest values.
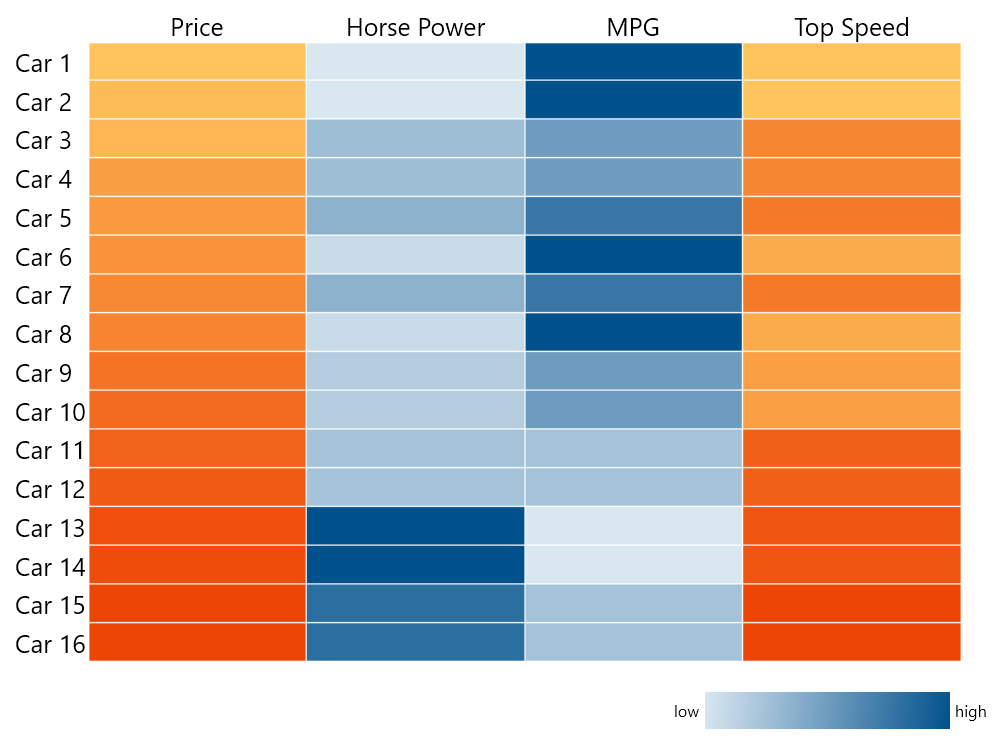
The following example demonstrates how to define an absolute HeatMapRangeColorizer and apply it to the Miles per Gallon column.
HeatMapRangeColorizer RangeColorizer1 = new HeatMapRangeColorizer() { IsAbsolute = true };
RangeColorizer1.Colors.Add(new HeatMapRangeColor() { Color = new Color() { R = 217, G = 231, B = 241, A = 255 }, From = 19, To = 22 });
RangeColorizer1.Colors.Add(new HeatMapRangeColor() { Color = new Color() { R = 164, G = 194, B = 216, A = 255 }, From = 23, To = 26 });
RangeColorizer1.Colors.Add(new HeatMapRangeColor() { Color = new Color() { R = 110, G = 156, B = 191, A = 255 }, From = 27, To = 30 });
RangeColorizer1.Colors.Add(new HeatMapRangeColor() { Color = new Color() { R = 55, G = 118, B = 165, A = 255 }, From = 31, To = 34 });
RangeColorizer1.Colors.Add(new HeatMapRangeColor() { Color = new Color() { R = 1, G = 81, B = 140, A = 255 }, From = 35, To = 40 });
MilesPerGallonMapping.Colorizer = RangeColorizer1;
<telerik:MemberMapping x:Name="MilesPerGallonMapping" Header="MPG" ValuePath="MilesPerGallon">
    <telerik:MemberMapping.Colorizer>
        <telerik:HeatMapRangeColorizer IsAbsolute="True">
            <telerik:HeatMapRangeColor From="19" To="22" Color="#D9E7F1"/>
            <telerik:HeatMapRangeColor From="23" To="26" Color="#A4C2D8"/>
            <telerik:HeatMapRangeColor From="27" To="30" Color="#6E9CBF"/>
            <telerik:HeatMapRangeColor From="31" To="34" Color="#3776A5"/>
            <telerik:HeatMapRangeColor From="35" To="40" Color="#01518C"/>
        </telerik:HeatMapRangeColorizer>
    </telerik:MemberMapping.Colorizer>
</telerik:MemberMapping>
Desaturation Colorizer
The HeatMapDesaturationColorizer reduces the level of saturation of a given StartColor depending on the RadHeatMapItem value. To control the level of desaturation, use the From and To properties.
When the From property equals 0, you are allowed to get a completely white color for the smallest value. If it is set to a value greater than 0, for example 0.1, the smallest value will get a strongly faded StartColor but will not be completely white.
On the other hand, if To is set to 0.8, you will get a somewhat faded StartColor for the greatest value. Like the other colorizers, the HeatMapDesaturationColorizer delivers the relative and absolute modes, which are set again through the IsAbsolute property.
In the relative mode, the colorizer will look for the smallest and greatest values from the items, or they can be set through the
RangeMinimumandRangeMaximumcolors.In the absolute mode, you have to set these two properties. Otherwise, the HeatMap will throw an exception.
The following example demonstrates how to define and apply the HeatMapDesaturationColorizer.
HeatMapDesaturationColorizer desaturationColorizer = new HeatMapDesaturationColorizer()
{
    StartColor = new Color() { R = 1, G = 81, B = 140, A = 255 },
    To = 0.1,
};

priceMemberMapping.Colorizer = desaturationColorizer;
<telerik:MemberMapping x:Name="priceMemberMapping" Header="Price" ValuePath="Price">
    <telerik:MemberMapping.Colorizer>
        <telerik:HeatMapDesaturationColorizer To="0.1" StartColor="#01518C"/>
    </telerik:MemberMapping.Colorizer>
</telerik:MemberMapping>
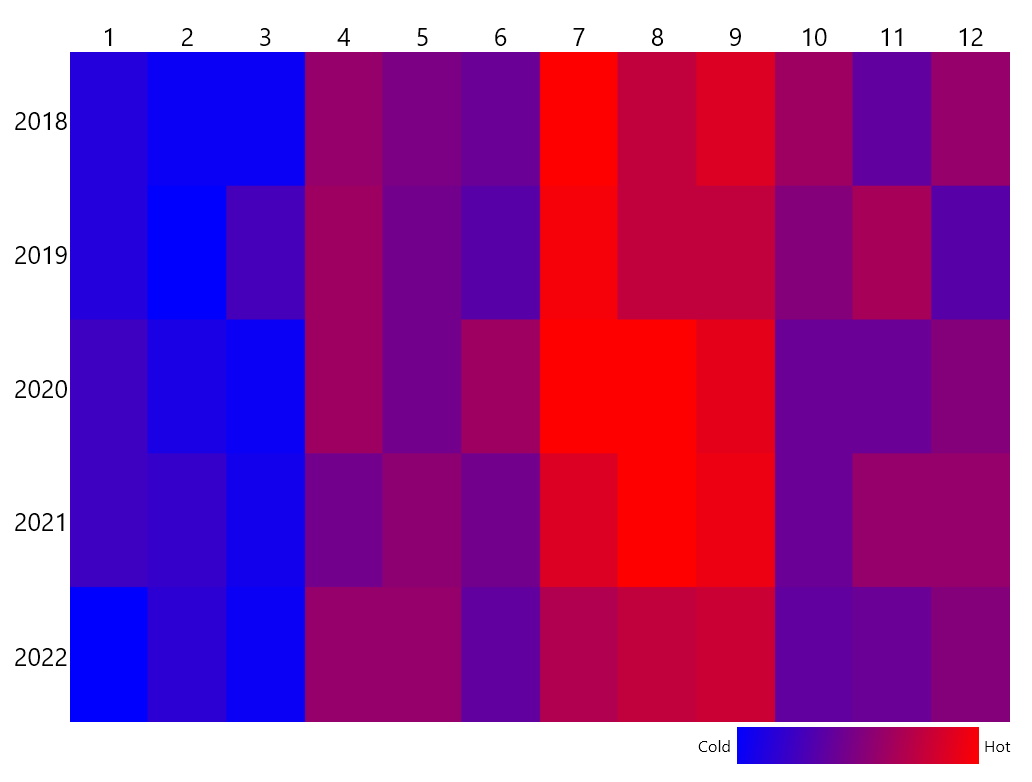
Categorical Definition Colorizer
Both the Categorical and the Horizontal/Vertical definition colorizers behave in the same way. However, in the Categorical you can apply only one colorizer at a time.
public class MonthlyTemp
{
    public DateTime Time { get; set; }
    public double Temp { get; set; }
    public MonthlyTemp(DateTime time, double temp)
    {
        this.Time = time;
        this.Temp = temp;
    }
}
var time = new DateTime(2018, 1, 1);
var result = new List<MonthlyTemp>();
Random r = new Random();

for (int i = 0; i < 5; i++)
{
    for (int a = 0; a < 3; a++)
    {
        result.Add(new MonthlyTemp(time, r.Next(0, 10)));
        time = time.AddMonths(1);
    }
    for (int a = 0; a < 3; a++)
    {
        result.Add(new MonthlyTemp(time, r.Next(10, 20)));
        time = time.AddMonths(1);
    }
    for (int a = 0; a < 3; a++)
    {
        result.Add(new MonthlyTemp(time, r.Next(20, 30)));
        time = time.AddMonths(1);
    }
    for (int a = 0; a < 3; a++)
    {
        result.Add(new MonthlyTemp(time, r.Next(10, 20)));
        time = time.AddMonths(1);
    }
}

this.radHeatMap.Definition.ItemsSource = result;
<Grid Background="White" Width="800" Height="600">
    <Grid.RowDefinitions>
        <RowDefinition Height="15*"/>
        <RowDefinition Height="*"/>
    </Grid.RowDefinitions>

    <telerik:RadHeatMap x:Name="radHeatMap" ShowToolTips="True" CellBorderThickness="0" FontSize="20">
        <telerik:RadHeatMap.Definition>
            <telerik:CategoricalDefinition
                                    ColumnGroupMemberPath="Time.Month"
                                    RowGroupMemberPath="Time.Year"
                                    ValuePath="Temp">
                <telerik:CategoricalDefinition.Colorizer>
                    <telerik:HeatMapValueGradientColorizer>
                        <GradientStop Offset="0" Color="Blue" />
                        <GradientStop Offset="1" Color="Red" />
                    </telerik:HeatMapValueGradientColorizer>
                </telerik:CategoricalDefinition.Colorizer>
            </telerik:CategoricalDefinition>
        </telerik:RadHeatMap.Definition>
    </telerik:RadHeatMap>

    <Grid Grid.Row="1" Width="250" HorizontalAlignment="Right">
        <Grid.ColumnDefinitions>
            <ColumnDefinition Width="Auto" />
            <ColumnDefinition />
            <ColumnDefinition Width="Auto" />
        </Grid.ColumnDefinitions>
        <TextBlock Grid.Column="0" Text="Cold" VerticalAlignment="Center" FontSize="13" />
        <TextBlock Grid.Column="2" Text="Hot" VerticalAlignment="Center" FontSize="13" />
        <Border Grid.Column="1" Margin="4">
            <Border.Background>
                <LinearGradientBrush>
                    <GradientStop Offset="0.0" Color="Blue"/>
                    <GradientStop Offset="1.0" Color="Red"/>
                </LinearGradientBrush>
            </Border.Background>
        </Border>
    </Grid>
</Grid>