WinUI BulletGraph Overview
The Telerik UI for WinUI BulletGraph component is a variation of a linear gauge. It uses the LinearBarGaugeIndicator classes and derives most of their features.
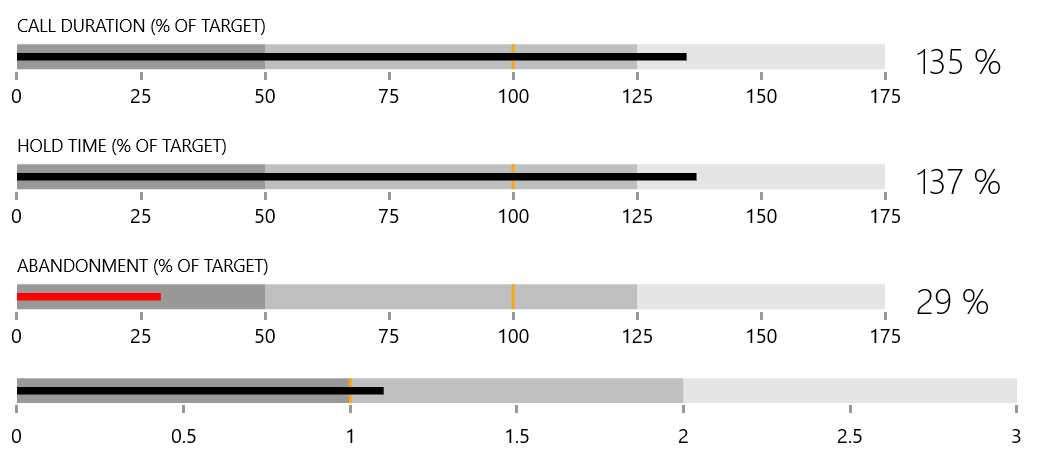
The BulletGraph combines a number of indicators and a data indicator into one control, which is lightweight, easily customizable, and straightforward to configure and use. The control is a great tool for creating dashboards that present a lot of information in a relatively small size.
The RadBulletGraph is a 100% lookless control, making it fully customizable. Also, you can easily bind the BulletGraph to your business data, either by setting its properties directly, or by using a binding declaration.
The is part of Telerik UI for WinUI, a
professional grade UI component library for building modern and feature-rich applications. To try it out sign up for a free 30-day trial.
![]()
Key Features
Featured measure—The BulletGraph enables you to display a featured measure visual to indicate the progress of a task.
Comparative measure—The comparative measure visual allows you to indicate a certain threshold.
Projected measure—The projected measure visual enables you to compare the progress shown as the featured measure.
Qualitative ranges—You can use the BulletGraph colored ranges to highlight portions of the scale.
Reverse scale—When the defined satisfactory area is close to the start value, the BulletGraph allows you to render a scale that goes from right to left.
Labels—The BulletGraph provides extensive settings for controlling its scale labels including their position, appearance, and interval.
Ticks—You can also control the BulletGraph scale ticks and set their interval and appearance.
Telerik UI for WinUI Support and Learning Resources
- Telerik UI for WinUI BulletGraph Homepage
- Get Started with the Telerik UI for WinUI BulletGraph
- Telerik UI for WinUI API Reference
- Getting Started with Telerik UI for WinUI Components
- Telerik UI for WinUI BulletGraph Forums