WinForms Chart Series Overview
Series refers to a series of data points displayed in the chart. The RadChart Series object is a collection of ChartSeriesItem objects. The number of series used depends on the type of chart. A Pie chart type only uses a single series. "Stacked" charts like the Stacked Area chart use several series.
Each ChartSeries object contains a collection of ChartSeriesItem objects that contain the actual data points displayed on the chart. You can add data to a series programmatically at run time, at design time in the Properties Window of Visual Studio, declaratively in the ASP.NET HTML markup, or by binding to a data source.
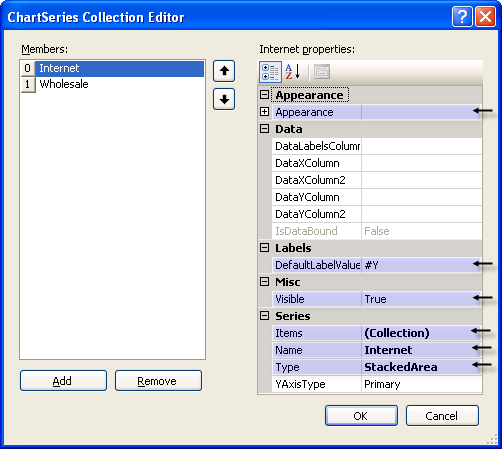
Some key properties for the ChartSeries are:
Appearance: This property contains the common appearance related properties such as Border, Corners, FillStyle and TextAppearance. In addition there are series specific properties including LabelAppearance, LineSeriesAppearance, LegendDisplayMode, BubbleSize and PointMark.
DefaultLabelValue: Specifies a format for label values. This allows you to display data points as numeric amounts, percentages, totals or any format described in this MSDN article Standard Numeric Format Strings
Items: The collection of ChartSeriesItem objects that contain data points.
Name: By default this name is displayed in the legend for the series.
Types: Use this property to select the chart type. Valid values are Bar, StackedBar, StackedBar100, Line, Area, StackedArea, StackedArea100, Pie, Gantt, Bezier, Spline, Bubble, Point, SplineArea, StackedSplineArea and StackedSplineArea100.
-
Visible: Turn this property off to hide the series.

DataRelatedPropertiesSeries