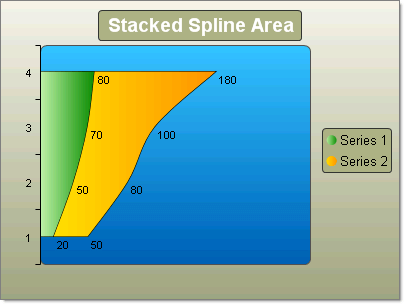
Stacked Spline Area Charts
The Stacked Spline Area chart is a variation of the Spline Area chart. The areas are stacked so that each series adjoins but does not overlap the preceding series. This contrasts with the Stacked Area chart where each series overlays the preceding series.
To create a simple vertical Stacked Spline Area Chart set the SeriesOrientation property to Vertical. Set the RadChart DefaultType property or ChartSeries.Type to StackedSplineArea. Create multiple chart series and add chart items with Y or X and Y values.
To create a simple vertical Stacked Spline Area Chart set the SeriesOrientation property to Horizontal. Set the RadChart DefaultType property or ChartSeries.Type to StackedSplineArea. Create multiple chart series and add chart items with Y or X and Y values.
