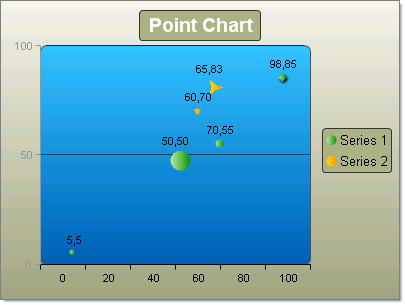
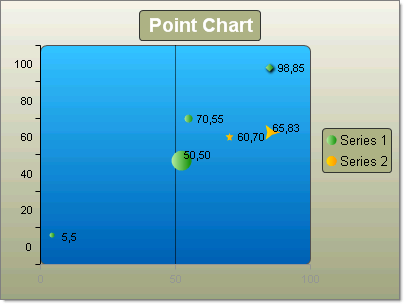
Point Charts
Point or "Scatter" charts are used to show correlations between two sets of values. The point chart lets you observe the dependence of one value to another and is often used for scientific data modeling. The Point chart is typically not used used with time dependent data where a Line chart is more suited.
To change the display of any given point use the chart item's PointAppearance property. Here you can change the Dimensions property to control Height, Width, Margins and Paddings. The Figure property lets you choose from a set of predefined shapes other than the default Ellipse shape (e.g. Cross, Diamond, Circle, Rectangle, Triangle and several different Star marker shapes).
To create a Vertical Point Chart set the SeriesOrientation property to Vertical. Set the RadChart DefaultType property or ChartSeries.Type to Point. Add one or more chart series to the Series collection. Add one or more chart items to the series Items collection. Populate numeric values for XValue and YValue properties of each chart series item.

To create a Horizontal Point Chart set the SeriesOrientation property to Horizontal. Set the RadChart DefaultType property or ChartSeries.Type to Point. Add one or more chart series to the Series collection. Add one or more chart items to the series Items collection. Populate numeric values for XValue and YValue properties of each chart series item.
