Gantt Charts
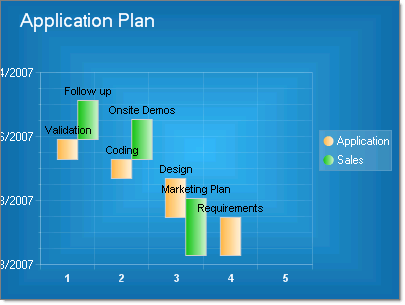
Gantt charts help visualize time based information. Gantt charts, also known as Time charts, display separate events, with a beginning and an end. These charts are often used for project/time planning, where data can be plotted using a date-time scale or a numerical scale.
To create a vertical Gantt Chart set the SeriesOrientation property to Vertical. Set the RadChart DefaultType property or ChartSeries.Type to Gantt.
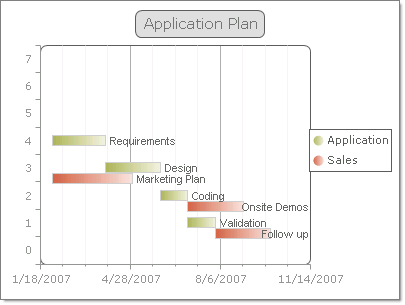
To create a horizontal Gantt Chart set the SeriesOrientation property to Horizontal. Set the RadChart DefaultType property or ChartSeries.Type to Gantt.
Other Gantt chart issues:
To add dates to an axis or chart item, values must be converted to OleAutomation types. Use the DateTimeToOADate() function for this purpose.
When setting a range for an axis that involves dates, set the axis IsZeroBased property to zero. This avoids having the range calculated from the minimum date value forward, instead of a range you define.
Use the ValueFormat property to display values as dates.
radChart1.PlotArea.YAxis.Appearance.ValueFormat = Telerik.Charting.Styles.ChartValueFormat.ShortDate;
RadChart1.PlotArea.YAxis.Appearance.ValueFormat = Telerik.Charting.Styles.ChartValueFormat.ShortDate