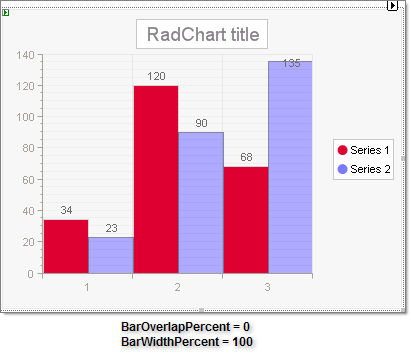
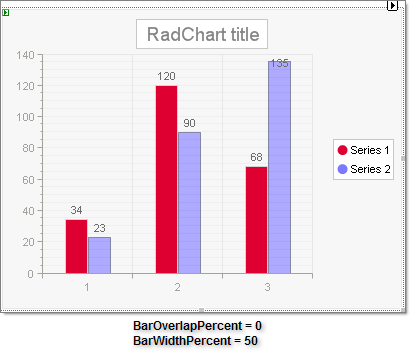
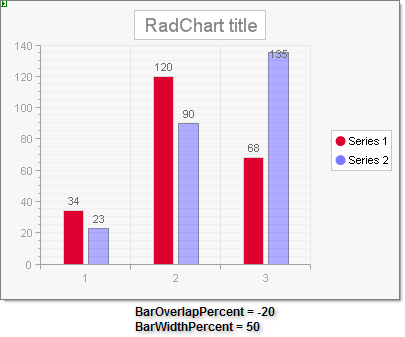
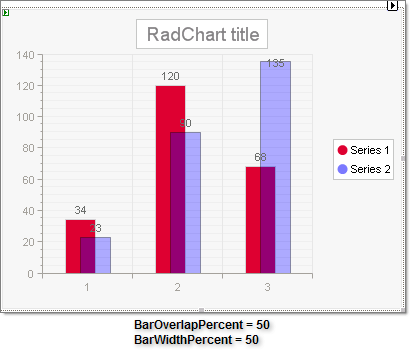
BarOverlapPercent and BarWidthPercent
In bar charts with multiple series BarOverlapPercent governs to what degree the bars will overlap the preceding bar series. If you enter a negative value for BarOverlapPercent , a gap appears between the bars of different series. Overlapping is especially useful when a long series of items needs to fit in a small-size chart.
BarWidthPercent controls how much space each bar takes up so that a BarWidthPercent of 100 will have all the bars in the chart taking exactly all the available width.
The maximum bar width is calculated as follows: bar width = axis length / bars count .
See the examples below to see how these two properties work together.