Data Binding RadChart to a Database Object
To bind to a database, create a data source object, assign the data source to the RadChart and call the RadChart DataBind() method.

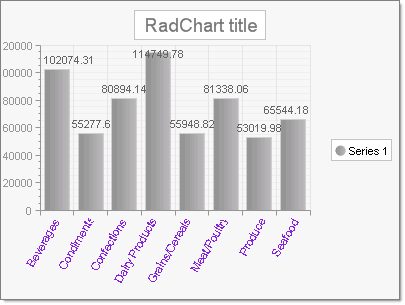
The figure above shows a running example that starts with a default RadChart with a single Series. The example code:
Creates a SqlDataSource, adds it to the page, assigns the RadChartDataSourceID property and finally binds to the datasource.
Displays data for a database column by assigning the series DataYColumn or DataXColumn properties. In the example the "TotalSales" column is assigned to the DataYColumn property.
Displays database column data in the X axis labels by assigning the column name to the DataLabelsColumn. The example assigns "CategoryName" to the DataLabelsColumn property.
Also note how the example sets the PlotArea.Appearance.Dimensions.Margins.Bottom to 30% and the PlotArea.XAxis.Appearance.LabelAppearance.RotationAngle to 300 in order to provide room for the axis labels.
RadChart radChart1 = new RadChart();
public DataBindingToDataBaseObject()
{
    InitializeComponent();
    this.Controls.Add(radChart1);
    String connectionString = @"Integrated Security=SSPI;Persist Security Info=False; Initial Catalog=Northwind;Data Source=.\sqlexpress";
    string selectCommand = "SELECT CategoryName, SUM(ProductSales) AS TotalSales FROM [Product Sales for 1997] GROUP BY CategoryName";
    SqlDataAdapter dataAdapter = new SqlDataAdapter(selectCommand, connectionString);
    DataTable table = new DataTable();
    dataAdapter.Fill(table);
    radChart1.DataSource = table;
    radChart1.PlotArea.XAxis.DataLabelsColumn = "CategoryName";
    radChart1.DataBound += new EventHandler<EventArgs>(radChart1_DataBound);
}
void radChart1_DataBound(object sender, EventArgs e)
{
    radChart1.Series[0].DataYColumn = "TotalSales";
    // assign appearance related properties
    radChart1.PlotArea.XAxis.Appearance.LabelAppearance.RotationAngle = 300;
    radChart1.PlotArea.XAxis.Appearance.TextAppearance.TextProperties.Color = System.Drawing.Color.BlueViolet;
    radChart1.PlotArea.Appearance.Dimensions.Margins.Bottom = Telerik.Charting.Styles.Unit.Percentage(25);
    radChart1.PlotArea.Appearance.Dimensions.Margins.Left = Telerik.Charting.Styles.Unit.Percentage(20);
    this.AutoSize = true;
}
Dim RadChart1 As New RadChart
Public Sub New()
    InitializeComponent()
    Me.Controls.Add(RadChart1)
    Dim connectionString As [String] = "Integrated Security=SSPI;Persist Security Info=False; Initial Catalog=Northwind;Data Source=.\sqlexpress"
        Dim selectCommand As String = "SELECT CategoryName, SUM(ProductSales) AS TotalSales FROM [Product Sales for 1997] GROUP BY CategoryName"
        Dim dataAdapter As New SqlDataAdapter(selectCommand, connectionString)
        Dim table As New DataTable()
        dataAdapter.Fill(table)
        RadChart1.DataSource = table
        RadChart1.PlotArea.XAxis.DataLabelsColumn = "CategoryName"
        AddHandler RadChart1.DataBound, AddressOf radChart1_DataBound
    End Sub
Private Sub radChart1_DataBound(ByVal sender As Object, ByVal e As EventArgs)
        radChart1.Series(0).DataYColumn = "TotalSales"
        ' assign appearance related properties
        radChart1.PlotArea.XAxis.Appearance.LabelAppearance.RotationAngle = 300
        radChart1.PlotArea.XAxis.Appearance.TextAppearance.TextProperties.Color = System.Drawing.Color.BlueViolet
        RadChart1.PlotArea.Appearance.Dimensions.Margins.Bottom = Telerik.Charting.Styles.Unit.Percentage(20)
        RadChart1.PlotArea.Appearance.Dimensions.Margins.Left = Telerik.Charting.Styles.Unit.Percentage(20)
    End Sub