Area Charts
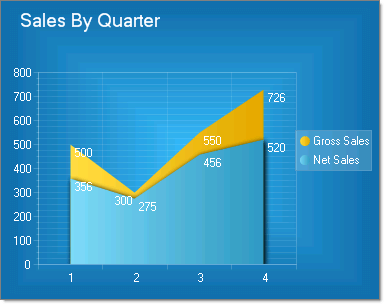
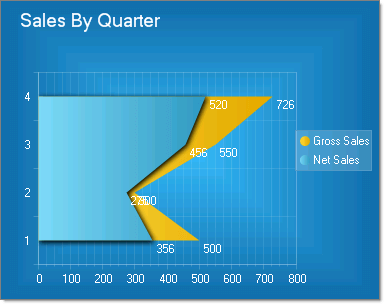
The Area chart consists of a series of data points joined by a line and where the area below the line is filled. Area charts are appropriate for visualizing data that fluctuates over a period of time and can be useful for emphasizing trends. Note: Values that don't vary too wildly work best for area charts.
Area charts display series in the order they are added, back-to-front. Depending on the Skin used, RadChart can automatically differentiate each series by displaying it in a different color. The appearance for each series can also be modified directly.
To create a Vertical Area Chart set the SeriesOrientation property to Vertical. Set the RadChart DefaultType property or ChartSeries.Type to Area.

To create a Horizontal Area Chart set the SeriesOrientation property to Horizontal. Set the RadChart DefaultType property or ChartSeries.Type to Area.
