.NET MAUI Chart ToolTip Behavior
The Tooltip behavior of the Chart handles rendering concise information about a data point in a small popup which is displayed close to its relevant data point.
Features
The ToolTip behavior of the Chart supports the TriggerMode property that determines the gestures on which the ChartToolTipBehavior will show a tool tip. The available values are:
- Tap
- Hold
Example
The following example shows how the ToolTip behavior of the Chart works:
1. Create the business object:
public class TemporalData
{
    public DateTime Date { get; set; }
    public double Value { get; set; }
}
2. Create a ViewModel:
public class ViewModel
{
    public ObservableCollection<TemporalData> Data { get; set; }

    public ViewModel()
    {
        this.Data = new ObservableCollection<TemporalData>(GetDateTimeData(200));
    }

    private static List<TemporalData> GetDateTimeData(int itemsCount)
    {
        var startDate = new DateTime(2015, 03, 01);

        List<TemporalData> items = new List<TemporalData>();
        for (int i = 0; i < itemsCount; i++)
        {
            TemporalData data = new TemporalData();
            data.Date = startDate.AddDays(i);

            if (i % 2 == 0)
            {
                data.Value = i + 5;
            }
            else
            {
                if (i % 5 == 0)
                {
                    data.Value = i - 15;
                }
            }

            items.Add(data);
        }

        return items;
    }
}
3. Declare a RadCartesianChart in XAML:
<telerik:RadCartesianChart PaletteName="Light"
                                Zoom="2, 1">
    <telerik:RadCartesianChart.BindingContext>
        <local:ViewModel/>
    </telerik:RadCartesianChart.BindingContext>
    <telerik:RadCartesianChart.HorizontalAxis>
        <telerik:DateTimeContinuousAxis LabelFitMode="Rotate"
                                             MajorStepUnit="Day"
                                             PlotMode="OnTicks"
                                             LabelFormat="dd MMM"
                                             MajorStep="20"
                                             ShowLabels="True"/>
    </telerik:RadCartesianChart.HorizontalAxis>
    <telerik:RadCartesianChart.VerticalAxis>
        <telerik:NumericalAxis />
    </telerik:RadCartesianChart.VerticalAxis>
    <telerik:RadCartesianChart.Series>
        <telerik:LineSeries ValueBinding="Value"
                                 CategoryBinding="Date"
                                 DisplayName="Sales"
                                 ItemsSource="{Binding Data}"/>
    </telerik:RadCartesianChart.Series>
    <telerik:RadCartesianChart.ChartBehaviors>
        <telerik:ChartTooltipBehavior TriggerMode="Tap" />
     </telerik:RadCartesianChart.ChartBehaviors>
</telerik:RadCartesianChart>
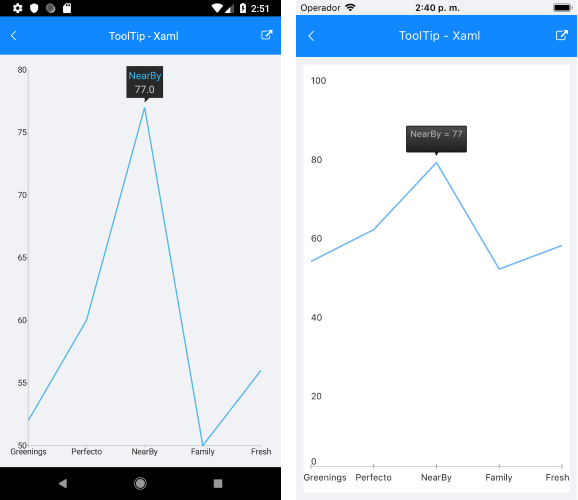
The following image shows how the ToolTip looks: