Map Types Overview
To present the Map data in the most user-friendly way, the Map report item supports a number of map types, which have unique characteristics to help you visualize your dataset.
The Map supports the following map types:
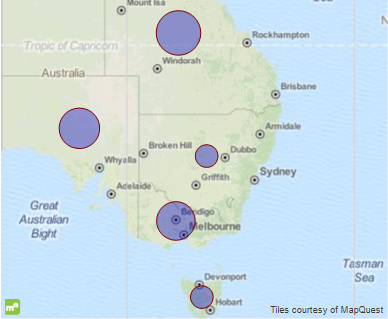
Point
Similar to the Scatter chart type of the Graph, the Point map type is used to display a correlations between two sets of values. The main difference is that the set of the first values is defined by geographical coordinates which will position every data point onto the Map. The set of he second values is used as a measure and displays a bubble of a variable size depending on the measured value, that is, the differences between the data points are based on the size of the point. The larger the point is, the greater the difference between the two data points becomes.

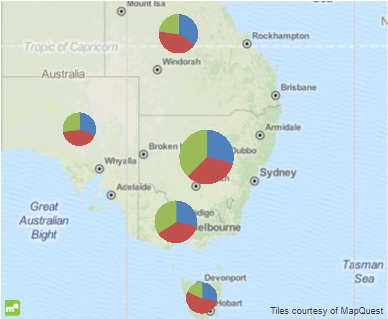
Pie
Similar to the Pie chart type of the Graph, a Pie map type is a chart for displaying grouped data on every data point. As with the Point map type, the data point coordinates are defined by the GeoLocation group. The analytical data for creating the Pie chart is obtained through the child groups of the GeoLocation group. For more information about the setup, refer to the article on setting the Map with the Map Wizard.

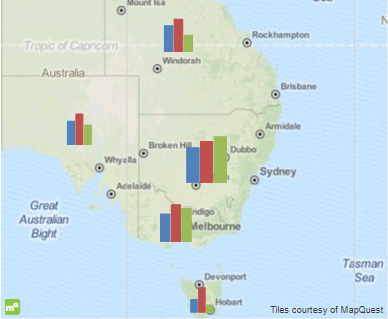
Column
Identical to the Pie chart type of the Graph, the Column map type presents analytical data by using the Column chart type. For an advanced example on creating a Column map type, refer to the article about creating a Map with a BarChart series with a CSV data source.

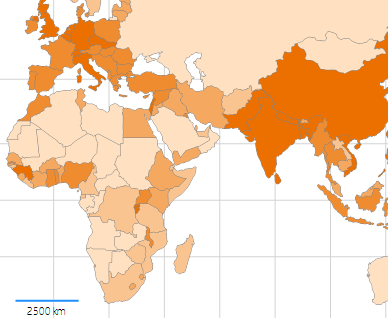
Choropleth
The Choropleth map type is a thematic map that uses graded color differences to display a measure over predefined regions or areas, and is one of the most popular ways to visualize how a measure varies across a geographic area.
The Choropleth item is basically a Map item with a special kind of series and groups. To create a Choropleth map, you don't have to configure a location provider or use a GeoLocationMapGroup to obtain the coordinates of the data points. Instead, the Choropleth uses a ShapeMapSeries instance whose major distinction from the other Map series is that they define the source which will be used to provide the spatial data. This source can be either a string, formatted in compliance with the Well-known text or Well-known binary standards, or an ESRI Shapefile.
To improve the appearance, the Map item can define a tile provider which will draw an image of the requested Map extent as a background layer onto the plot area.
To create a Choropleth map type, refer to the article about setting up a Choropleth by using the Map Wizard.

Customizing Map Types
The Map also provides specific approaches to build on top of its available options by allowing you to add ShapeMapSeries instances and LocationMapSeries instances to the report item as well as to use the BarChart Series in the map.
Shape Map Series
The ShapeMapSeries uses its own source to obtain a set of coordinates which will determine the shape of the data points. These series do not use a LocationProvider or a GeoLocationMapGroup, because the data points are not determined by a single location on the map surface, as with the LocationMapSeries.
To create a Shape Map Series map type, refer to the article about adding a ShapeMapSeries instance to the Map report item.
Location Map Series
The LocationMapSeries are used when the data points have a single coordinate pair, obtained directly from the data set or by using a location provider.
To create a Location Map Series map type, refer to the article about adding a LocationMapSeries instance to the Map report item.
Map with a BarChart Series
To create a Map with BarChart Series and CSV data source, refer to the article about creating a Map report item with BarChart series.