Adding ShapeMapSeries Instances to the Map
In this article, you will learn how to add a ShapeMapSeries instance to the Map report item.
To add new ShapeMapSeries instance to the Map:
-
Open the Series collection editor and Add a new
ShapeMapSeriesitem.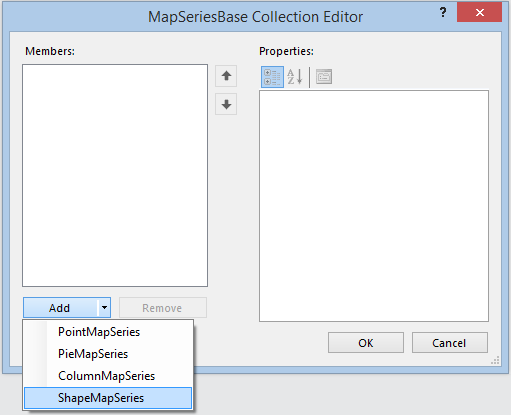
Set the
ShapeMapGroupto an existingShapeMapGroupinstance or create a new one from scratch.- Set the
SeriesGroupto an existingMapGroupinstance or create a new one from scratch. - Set an expression for the
ColorDatafield to define the value that will be used to calculate the data point color. -
Set the
RangeGroupingproperty to any of theNone,EqualInterval, orEqualDistributionavailable options.-
Nonemeans that no grouping will be used and every data point will be colored according to its respective color data value.When the
RangeGroupingproperty is set toNone, theColorsCountvalue is not respected. EqualIntervalwill split the interval between the minimum and maximum values by the colors count, assigning a separate color to each interval.-
EqualDistributionwill try to distribute the data evenly among the groups defined by theColorsCountproperty, assigning a separate color to each group.
-
Set the
ColorsCountproperty depending on the number of groups in which you want to split the data values. When theRangeGroupingis set toNone, the legend will contain only two items, showing the minimum and maximum data values. However, if the data set contains less records than the desired colors count, the legend will display items only for the available data records.- Set up the
LegendItem.Valueexpression by using the specificRangeMinandRangeMaxreferences that determine the minimum and maximum values of the respective data range. - Set up the
ColorPaletteproperty to define a range of colors that will be used when displaying the data points.GradientPaletteis recommended. -
Define the source for the shapes.
-
To use a Well-known text (WKT) or its binary representation (WKB) as a source for your shapes, select the SourceType property and choose WellKnownText from the drop-down list. In the SpatialField property, write an expression or select the data set field that will provide the WKT or WKB data. SpatialField is mandatory and it will be used by the processing engine to evaluate the contents of the field against the current data record and parse it as a Well-known text or Well-known binary.
Since the
ShapeMapSeriesdisplays polygons as its data points, the WKT or WKB contents will be used only if they contain valid POLYGON or MULTIPOLYGON definitions. The parsing of the points data will be done by using InvariantCulture, so make sure your WKT definition uses a period [.] as a decimal symbol.The nested (interior) polygon rings will be displayed as polygons with no color fill.
-
To use an
ESRI Shapefileas a shapes source, select the SourceType property and choose EsriShapeFile from the drop-down list. Set the path to the Shapefile as a value of the FileName property. The processing engine will resolve absolute and relative file paths, and also will try to download synchronously the file contents if it detects a valid URL. It is not necessary to provide the.shpfile extension. Using the Map Relation Pairs dialog, set up the RelationPairs property, pairing the fields from the analytical data set with fields from the spatial data set, produced by the DBF file that is contained in the Shapefile bundle.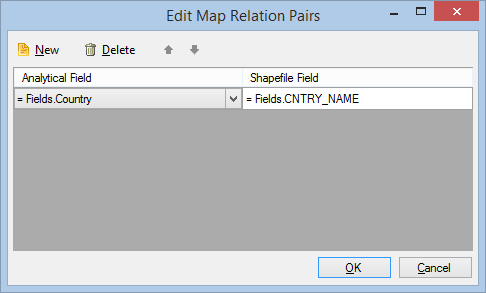
The engine will join the analytical data set with the spatial data set, preserving all the records from the spatial data set. In terms of SQL, if the spatial data set is
leftand the analytical data set isright, the processing engine will produce a left outer join.
-
To make the boundaries of the data points more distinctive from each other, apply additional styling.
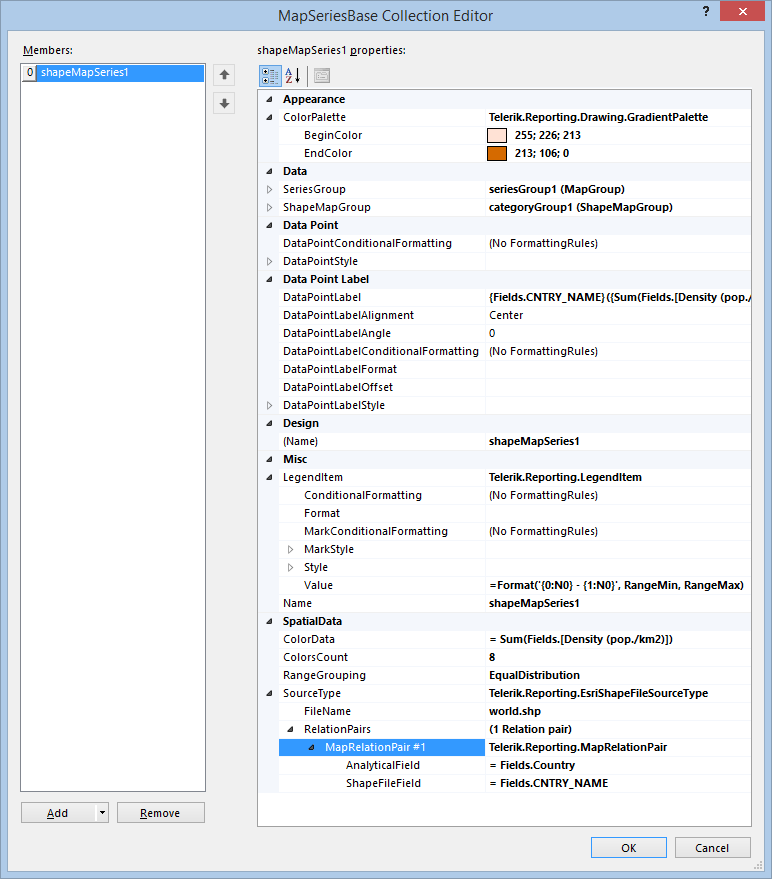
When all the properties are set, the ShapeMapSeries instance will look similar to the following one in the Property Grid: