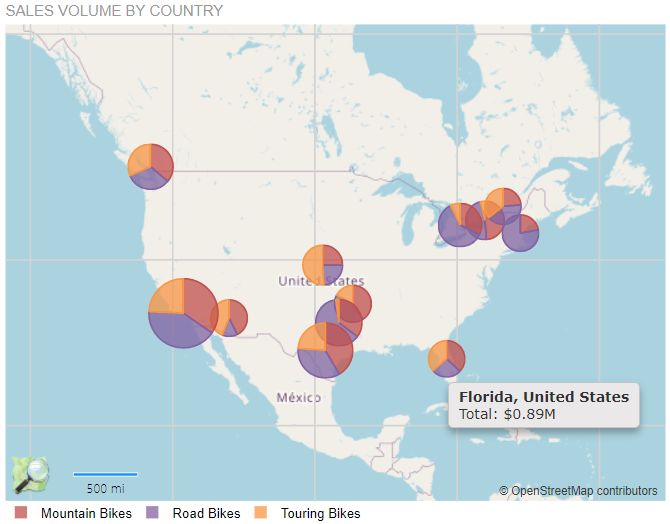
Map Overview
The Map report item is a native Telerik Reporting item which enables you to visualize an aggregated business data in a geographical manner.
The data may be presented in different formats that is determined by the chosen Map Type.

Key Features
- Structure and elements—You can utilize all available elements the visual structure of the Map report item supports.
- Connecting to data—The Map report item allows you to bind it to a single data object where you can control what data and in what way is geographically visualized through the Telerik Reporting Expression engine.
- Layers and hierarchy—The analytical data from the data source will be presented geographically on the Map based on your settings.
- Map types—The Map enables you to create different map types.
- Styling and formatting—The Map delivers extensive settings for configuring the rendering of its parallels and meridians, legend, and other elements.
Next Steps
- Getting Started with the Map Report Item
- (Demo) Sales Dashboard Report with a Map
- (Demo) Product Catalog Report with a Document Map
- (Demo) Population Density Report with a Choropleth Map
- (Demo) Crypto Currency Info Report with Choropleth and Point Series
- Map Class API Reference
- Demo Page for Telerik Reporting
- Knowledge Base Section