ChartView for Xamarin.Android: ScatterPointSeries
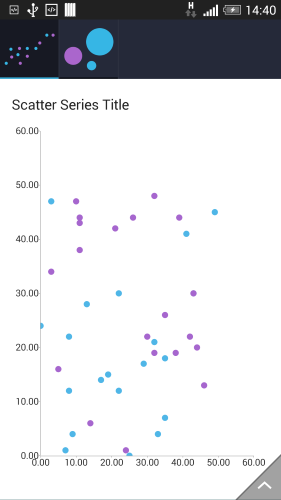
RadCartesianChartView visualizes each data item from the ScatterPointSeries as individual points on the plot area. ScatterPointSeries like all other scatter series require two numerical axes to function properly.
All scatter series are incompatible with all categorical axes.
Example
To create a chart with scatter series you need to create a chart object, add horizontal and vertical axes and add a scatter series object populated with data. It must be noted that the chart must have a LinearAxis set for both the horizontal and vertical axes.
Immediately below is the implementation of the initScatterData() method which is used to populate the scatter series with data along with the ScatterPoint class which serves as the actual chart data.
public class ScatterPoint : Java.Lang.Object
{
         public ScatterPoint(int x, int y)
    {
            this.X = x;
            this.Y = y;
         }

            public int X { get; set; }

            public int Y { get; set; }
    }

    public Java.Lang.IIterable InitScatterData()
{
        Java.Util.ArrayList data = new Java.Util.ArrayList ();
        Random random = new Random();
        for(int i = 0; i < 20; ++i)
    {
            data.Add(new ScatterPoint(random.Next(50), random.Next(50)));
        }

        return data;
    }
After you create the method for initialization of sample data, you can create a RadCartesianChartView with ScatterPointSeries by adding the following code to the onCreate() method of your Activity.
RadCartesianChartView chartView = new RadCartesianChartView(this);

ScatterPointSeries scatterSeries = new ScatterPointSeries();
scatterSeries.XValueBinding = new MonthResultDataBinding("X");
scatterSeries.YValueBinding = new MonthResultDataBinding("Y");
scatterSeries.Data = InitScatterData();
chartView.Series.Add(scatterSeries);

LinearAxis horizontalAxis = new LinearAxis();
chartView.HorizontalAxis = horizontalAxis;

LinearAxis verticalAxis = new LinearAxis();
chartView.VerticalAxis = verticalAxis;

ViewGroup rootView = (ViewGroup)FindViewById(Resource.Id.container);
rootView.AddView(chartView);
Here's the result:

Customization
ScatterPointSeries provide the following API to change their style:
- StrokePaint (of type Paint): changes the color used to draw points' stroke.
- FillPaint (of type Paint): changes the fill of the scatter points.
You can also customize the appearance of ScatterPointSeries by using Palettes.