ChartView for Xamarin.Android: SplineAreaSeries
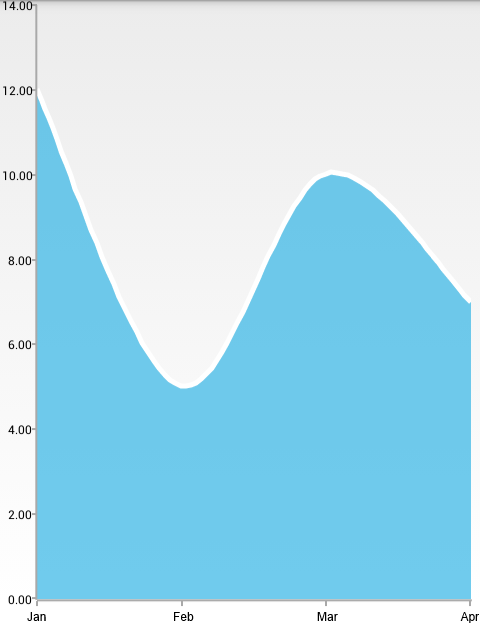
RadCartesianChartView visualizes SplineAreaSeries as an area on the chart that is enclosed by the coordinate axes and curved line segments that connect the data points represented by these series. The SplineAreaSeries extend AreaSeries, so they are also CategoricalSeries and require one CategoricalAxis and one LinearAxis.
Example
You can read from the Getting Started page how to define the MonthResult type and declare the initData() method.
After you create the method for initialization of sample data, you can create a RadCartesianChartView with SplineAreaSeries by adding the following code to the onCreate() method of your Activity.
InitData();

RadCartesianChartView chartView = new RadCartesianChartView(this);

SplineAreaSeries splineAreaSeries = new SplineAreaSeries();
splineAreaSeries.CategoryBinding = new MonthResultDataBinding ("Month");
splineAreaSeries.ValueBinding = new MonthResultDataBinding ("Result");
splineAreaSeries.Data = (Java.Lang.IIterable)this.monthResults;
chartView.Series.Add(splineAreaSeries);

CategoricalAxis horizontalAxis = new CategoricalAxis();
chartView.HorizontalAxis = horizontalAxis;

LinearAxis verticalAxis = new LinearAxis();
chartView.VerticalAxis = verticalAxis;

ViewGroup rootView = (ViewGroup)FindViewById(Resource.Id.container);
rootView.AddView(chartView);
This example assumes that your root container has id
container
Here's the result:

Customization
SplineAreaSeries extend AreaSeries, so they provide the same way to change their style — by using the following properties:
- StrokeColor: changes the color used to draw lines.
- StrokeThickness: changes the width of the lines.
- FillColor: changes the color used to fill the area shapes.
You can also customize the appearance of AreaSeries by using Palettes.