BoxPlotSeries
This type of series visualizes its data points using box plot shapes. An alternative name for this visualization is box and whiskers.
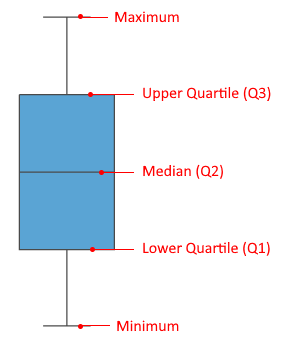
The box plot shape allows you to display a summarized information containing five values - minimum, maximum, lower quartile (Q1), upper quartile (Q3) and median - plotted on the numeric axis of the chart.
Figure 1: Box Plot Visual Structure
BoxPlotSeries works with one CategoricalAxis (or DateTime axis) as horizontal axis and one numeric axis (LinearAxis or LogarithmicAxis) as vertical axis. Any other combination of axes is unsupported.
To start using the series, add it in the Series collection of the chart and populate its DataPoints collection (or the ItemsSource).
Example 1: Defining BoxPlotSeries in XAML
 <telerik:RadCartesianChart>
    <telerik:RadCartesianChart.VerticalAxis>
        <telerik:LinearAxis />
    </telerik:RadCartesianChart.VerticalAxis>
    <telerik:RadCartesianChart.HorizontalAxis>
        <telerik:CategoricalAxis/>
    </telerik:RadCartesianChart.HorizontalAxis>
    <telerik:RadCartesianChart.Series>
        <telerik:BoxPlotSeries>
            <telerik:BoxPlotSeries.DataPoints>
                <telerik:BoxPlotDataPoint Category="A" Minimum="15" Maximum="80" LowerQuartile="40" UpperQuartile="70" Median="55"/>
                <telerik:BoxPlotDataPoint Category="B" Minimum="10" Maximum="60" LowerQuartile="25" UpperQuartile="45" Median="40"/>
                <telerik:BoxPlotDataPoint Category="C" Minimum="25" Maximum="75" LowerQuartile="35" UpperQuartile="55" Median="43"/>
            </telerik:BoxPlotSeries.DataPoints>
        </telerik:BoxPlotSeries>
    </telerik:RadCartesianChart.Series>
</telerik:RadCartesianChart>
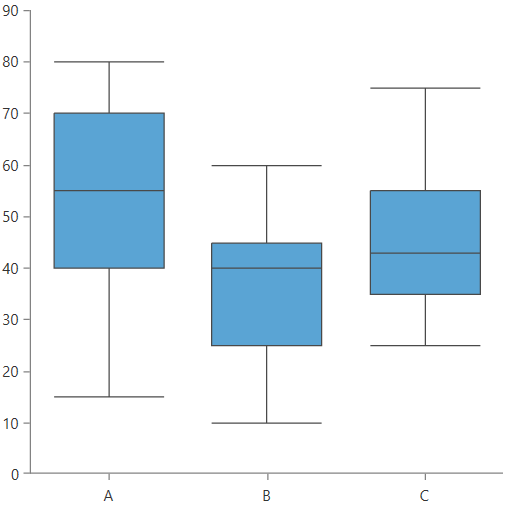
Figure 2: BoxPlotSeries example
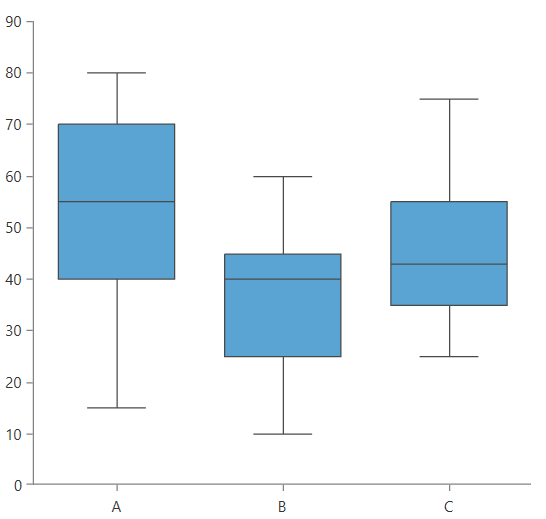
The box plot data points do not implement automatic coercion of the input values. This means that the provided values must be correct in order to display a proper visual element. Minimum must be smaller than Maximum and the interquartile range (between Q1 and Q3) must be within the Minimum/Maximum range.
Data Binding
The BoxPlotSeries works with data point objects of type BoxPlotDataPoint. In a data binding scenario a BoxPlotDataPoint will be created for each data item in the ItemsSource collection of the series. To map the properties of the business objects from the ItemsSource to the properties of the data point object, use the binding properties of the series:
- CategoryBinding
- MinimumBinding
- MaximumBinding
- LowerQuartileBinding
- UpperQuartileBinding
- MedianBinding
The following example shows how to create a simple object describing a box plot and populate the series with a sample collection.
Example 2: Defining the model
public class BoxPlotInfo
{
    public string Category { get; set; }
    public double Min { get; set; }
    public double Max { get; set; }
    public double Q1Value { get; set; }
    public double Q3Value { get; set; }
    public double Median { get; set; }
}
Example 3: Populating the data
public MyUserControl()
{
    InitializeComponent();

    var source = new ObservableCollection<BoxPlotInfo>()
    {
        new BoxPlotInfo() { Category = "C1", Min = 5, Max = 30, Q1Value = 10, Q3Value = 15, Median = 13 },
        new BoxPlotInfo() { Category = "C2", Min = 10, Max = 40, Q1Value = 15, Q3Value = 20, Median = 16 },
        new BoxPlotInfo() { Category = "C3", Min = 15, Max = 35, Q1Value = 20, Q3Value = 30, Median = 27 },
        new BoxPlotInfo() { Category = "C4", Min = 5, Max = 25, Q1Value = 10, Q3Value = 18, Median = 15 },
        new BoxPlotInfo() { Category = "C5", Min = 10, Max = 40, Q1Value = 15, Q3Value = 20, Median = 19 },
        new BoxPlotInfo() { Category = "C6", Min = 9, Max = 35, Q1Value = 20, Q3Value = 30, Median = 25 },
        new BoxPlotInfo() { Category = "C7", Min = 5, Max = 25, Q1Value = 10, Q3Value = 15, Median = 12 },
        new BoxPlotInfo() { Category = "C8", Min = 7, Max = 30, Q1Value = 15, Q3Value = 25, Median = 21 },
    };
    this.boxPlotSeries.ItemsSource = source;
}
Example 4: Defining BoxPlotSeries in data binding scenario
<telerik:RadCartesianChart>
    <telerik:RadCartesianChart.VerticalAxis>
        <telerik:LinearAxis />
    </telerik:RadCartesianChart.VerticalAxis>
    <telerik:RadCartesianChart.HorizontalAxis>
        <telerik:CategoricalAxis/>
    </telerik:RadCartesianChart.HorizontalAxis>
    <telerik:RadCartesianChart.Series>
        <telerik:BoxPlotSeries x:Name="boxPlotSeries"
                               CategoryBinding="Category"
                               MinimumBinding="Min"
                               MaximumBinding="Max"
                               LowerQuartileBinding="Q1Value"
                               UpperQuartileBinding="Q3Value"
                               MedianBinding="Median"/>
    </telerik:RadCartesianChart.Series>
</telerik:RadCartesianChart>
Figure 3: BoxPlotSeries data binding example
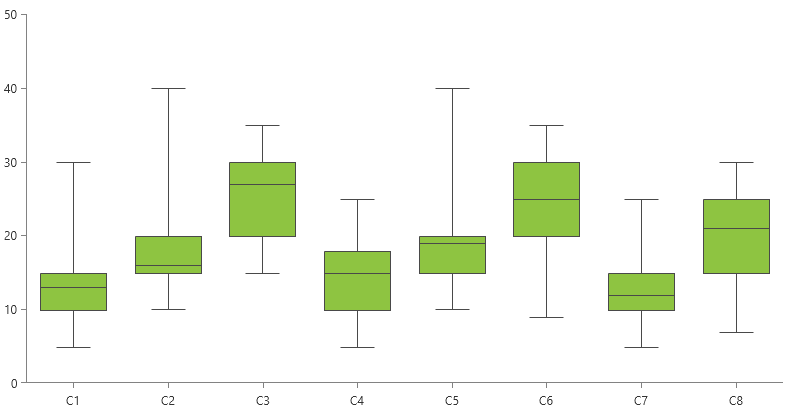
Read more about the data binding support in the Create Data-Bound Chart article.
Legend Settings
The chart series allows you to auto-generate LegendItem objects containing a title and color which can be used with the RadLegend control. To enable this, set the LegendSettings property of the series element.
Example 5: Using SeriesLegendSettings
 <Grid>
    <Grid.ColumnDefinitions>
        <ColumnDefinition />
        <ColumnDefinition Width="Auto"/>
    </Grid.ColumnDefinitions>
    <telerik:RadCartesianChart x:Name="chart" Palette="Fluent">
        <telerik:RadCartesianChart.VerticalAxis>
            <telerik:LinearAxis />
        </telerik:RadCartesianChart.VerticalAxis>
        <telerik:RadCartesianChart.HorizontalAxis>
            <telerik:CategoricalAxis />
        </telerik:RadCartesianChart.HorizontalAxis>
        <telerik:RadCartesianChart.Series>
            <telerik:BoxPlotSeries>
                <telerik:BoxPlotSeries.DataPoints>
                    <telerik:BoxPlotDataPoint Category="A" Minimum="15" Maximum="80" LowerQuartile="40" UpperQuartile="70" Median="55"/>
                    <telerik:BoxPlotDataPoint Category="B" Minimum="10" Maximum="60" LowerQuartile="25" UpperQuartile="45" Median="40"/>
                    <telerik:BoxPlotDataPoint Category="C" Minimum="25" Maximum="75" LowerQuartile="35" UpperQuartile="55" Median="43"/>
                </telerik:BoxPlotSeries.DataPoints>
                <telerik:BoxPlotSeries.LegendSettings>
                    <telerik:SeriesLegendSettings Title="First Series" />
                </telerik:BoxPlotSeries.LegendSettings>
            </telerik:BoxPlotSeries>
            <telerik:BoxPlotSeries>
                <telerik:BoxPlotSeries.DataPoints>
                    <telerik:BoxPlotDataPoint Category="A" Minimum="10" Maximum="60" LowerQuartile="25" UpperQuartile="45" Median="40"/>
                    <telerik:BoxPlotDataPoint Category="B" Minimum="25" Maximum="75" LowerQuartile="35" UpperQuartile="55" Median="43"/>
                    <telerik:BoxPlotDataPoint Category="C" Minimum="15" Maximum="80" LowerQuartile="40" UpperQuartile="70" Median="55"/>
                </telerik:BoxPlotSeries.DataPoints>
                <telerik:BoxPlotSeries.LegendSettings>
                    <telerik:SeriesLegendSettings Title="Second Series" />
                </telerik:BoxPlotSeries.LegendSettings>
            </telerik:BoxPlotSeries>
        </telerik:RadCartesianChart.Series>
    </telerik:RadCartesianChart>
    <telerik:RadLegend Items="{Binding ElementName=chart, Path=LegendItems}" Grid.Column="1" Margin="10"/>
</Grid>
Figure 4: Chart legend
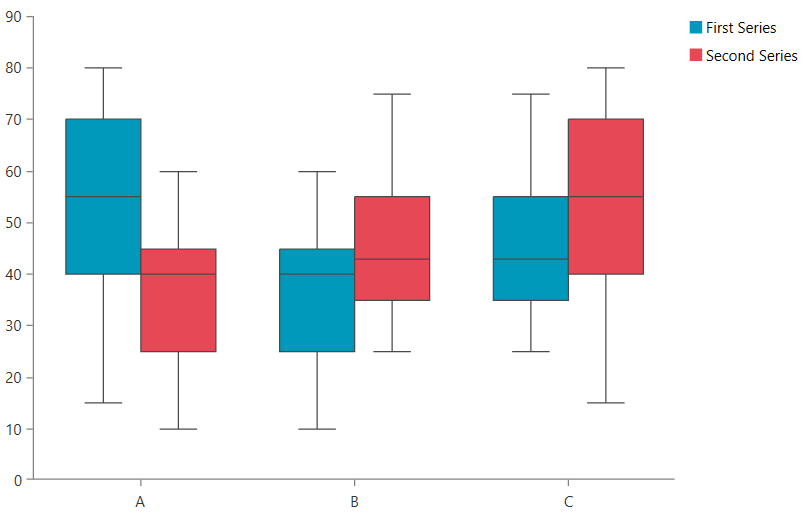
Read more about the chart's legend settings in the RadLegend Support article.
Appearance
The appearance of the box plot visual can be modified using several properties. Read more in the BoxPlot section of the Customizing CartesianChart Series help article.
Additionally, the Palette property of the chart to change the colors of the BoxPlotSeries on a global scale. Read more in the Palettes articles.
To change the length of the lines representing the minimum and maximum values of the box plot visual, set the LimitersLength property of the series. The property works with relative units between 0 and 1, where 1 means 100% of the layout slot's width. The default value is 0.5, which is 50% of the box plot's width.
Example 3: Setting LimitersLength
<telerik:BoxPlotSeries LimitersLength="1" />
Figure 4: Minimum and maximum lines matching the box plot's width