Histogram
The histogram visualization can be created with the ScatterRangeBarSeries.
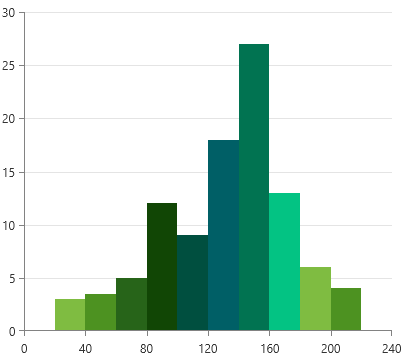
The ability of the ScatterRangeBarSeries to render bars sized on both axis directions - horizontal and vertical - allows you to adjust a histogram visualization. The following example shows how to define a basic histogram chart.
Creating histogram with ScatterRangeBarSeries
<telerik:RadCartesianChart Palette="Green">
    <telerik:RadCartesianChart.HorizontalAxis>
        <telerik:LinearAxis MajorStep="40" Maximum="240" />
    </telerik:RadCartesianChart.HorizontalAxis>
    <telerik:RadCartesianChart.VerticalAxis>
        <telerik:LinearAxis />
    </telerik:RadCartesianChart.VerticalAxis>
    <telerik:RadCartesianChart.Grid>
        <telerik:CartesianChartGrid MajorLinesVisibility="Y" />
    </telerik:RadCartesianChart.Grid>
    <telerik:ScatterRangeBarSeries>
        <telerik:ScatterRangeBarSeries.DataPoints>
            <telerik:ScatterRangeDataPoint HorizontalLow="20" HorizontalHigh="40" VerticalLow="0" VerticalHigh="3"/>
            <telerik:ScatterRangeDataPoint HorizontalLow="40" HorizontalHigh="60" VerticalLow="0" VerticalHigh="3.5"/>
            <telerik:ScatterRangeDataPoint HorizontalLow="60" HorizontalHigh="80" VerticalLow="0" VerticalHigh="5"/>
            <telerik:ScatterRangeDataPoint HorizontalLow="80" HorizontalHigh="100" VerticalLow="0" VerticalHigh="12"/>
            <telerik:ScatterRangeDataPoint HorizontalLow="100" HorizontalHigh="120" VerticalLow="0" VerticalHigh="9"/>
            <telerik:ScatterRangeDataPoint HorizontalLow="120" HorizontalHigh="140" VerticalLow="0" VerticalHigh="18"/>
            <telerik:ScatterRangeDataPoint HorizontalLow="140" HorizontalHigh="160" VerticalLow="0" VerticalHigh="27"/>
            <telerik:ScatterRangeDataPoint HorizontalLow="160" HorizontalHigh="180" VerticalLow="0" VerticalHigh="13"/>
            <telerik:ScatterRangeDataPoint HorizontalLow="180" HorizontalHigh="200" VerticalLow="0" VerticalHigh="6"/>
            <telerik:ScatterRangeDataPoint HorizontalLow="200" HorizontalHigh="220" VerticalLow="0" VerticalHigh="4"/>
        </telerik:ScatterRangeBarSeries.DataPoints>
    </telerik:ScatterRangeBarSeries>
</telerik:RadCartesianChart>
Using ChartHistogramSource
The ChartHistogramSource is a special collection element that allows you to provide one or two dimensional data collection and based on it automatically generates the ScatterRangeDataPoints for the associated series. This source is supported only by the ScatterRangeBarSeries.
By default, the source automatically selects the best interval between the bars, using the formula for Scott's normal reference rule. Then, it applies an aggregate function over the values for the set of data items that falls in the corresponding interval.
Using Collection of Numbers
The ChartHistogramSource can work with one directional data (a list of double values), where you can assign it to the ItemsSource property of the ChartHistogramSource. The following example shows how to prepare the data and setup the chart.
Preparing a collection of numbers
public MyUserControl()
{
    InitializeComponent();

    var r = new Random(0);
    var source = new ObservableCollection<double>();
    for (int i = 0; i < 50; i++)
    {
        source.Add(r.Next(1, 25));
    }
    this.histogramSource.ItemsSource = source;
}
Creating histogram with ScatterRangeBarSeries and ChartHistogramSource using collection of numbers
<Grid>
    <telerik:ChartHistogramSource x:Name="histogramSource"/>

    <telerik:RadCartesianChart Palette="Green">
        <telerik:RadCartesianChart.HorizontalAxis>
            <telerik:LinearAxis MajorStep="{Binding ElementName=histogramSource, Path=ActualInterval}" TickOrigin="1" Maximum="30"/>
        </telerik:RadCartesianChart.HorizontalAxis>
        <telerik:RadCartesianChart.VerticalAxis>
            <telerik:LinearAxis />
        </telerik:RadCartesianChart.VerticalAxis>
        <telerik:RadCartesianChart.Grid>
            <telerik:CartesianChartGrid MajorLinesVisibility="Y" />
        </telerik:RadCartesianChart.Grid>

        <telerik:ScatterRangeBarSeries ItemsSource="{Binding ElementName=histogramSource}"/>
    </telerik:RadCartesianChart>
</Grid>
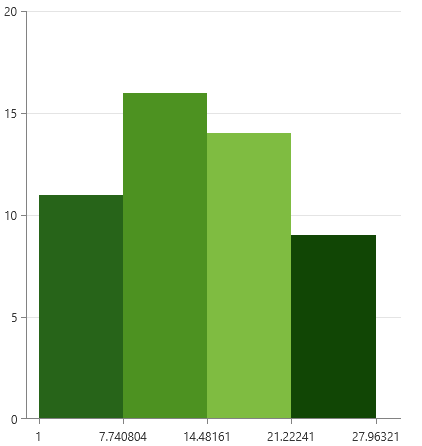
Count. This is the only supported function for this scenario.
Histogram with ChartHistogramSource and one dimensional data
Using Collection of Custom Objects
The ChartHistogramSource can work with two dimensional data, where you can provide a collection of complex objects to the ItemsSource. In that case, the IntervalValueBinding and ValueBinding properties should be set as well. This is needed in order to map the properties of the data item that should be used in the calculations of the data. The IntervalValueBinding points to the property that will be used to determine in which interval the data item will fall. Additionally, the values coming from this binding are used to auto-calculate the interval of the bars. The ValueBinding points to the property used to get the values of the data item that determine the bar's height.
Creating the data model
public class HistogramPlotInfo
    {
        public double Interval { get; set; }
        public double Value { get; set; }
    }
Preparing a collection of custom objects
public MyUserControl()
{
    InitializeComponent();

    var r = new Random(123456789);
    var source = new ObservableCollection<HistogramPlotInfo>();
    for (int i = 5; i < 25; i++)
    {
        double itemsCount = r.Next(1, 15);
        for (int k = 0; k < itemsCount; k++)
        {
            source.Add(new HistogramPlotInfo() { Interval = i, Value = r.Next(10, 100) });
        }
    }
    this.histogramSource.ItemsSource = source;
}
Creating histogram with ScatterRangeBarSeries and ChartHistogramSource using custom objects
<Grid>
    <telerik:ChartHistogramSource x:Name="histogramSource" ValueBinding="Value" IntervalValueBinding="Interval"/>

    <telerik:RadCartesianChart Palette="Green">
        <telerik:RadCartesianChart.HorizontalAxis>
            <telerik:LinearAxis MajorStep="{Binding ElementName=histogramSource, Path=ActualInterval}"
                                TickOrigin="5" LabelFormat="F2"/>
        </telerik:RadCartesianChart.HorizontalAxis>
        <telerik:RadCartesianChart.VerticalAxis>
            <telerik:LinearAxis />
        </telerik:RadCartesianChart.VerticalAxis>
        <telerik:RadCartesianChart.Grid>
            <telerik:CartesianChartGrid MajorLinesVisibility="Y" />
        </telerik:RadCartesianChart.Grid>
        <telerik:ScatterRangeBarSeries ItemsSource="{Binding ElementName=histogramSource}"/>
    </telerik:RadCartesianChart>
</Grid>
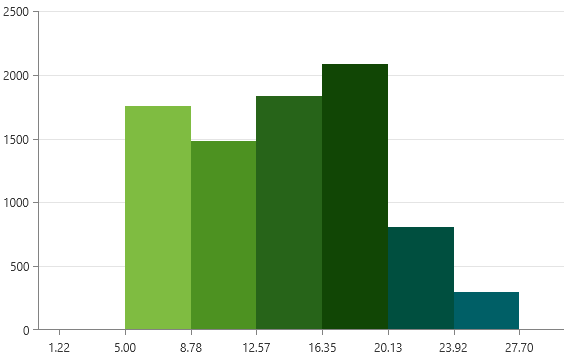
Sum.
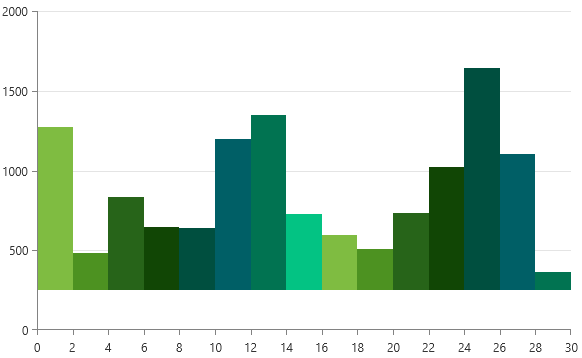
Histogram with ChartHistogramSource and collection of custom objects
Setting the Interval
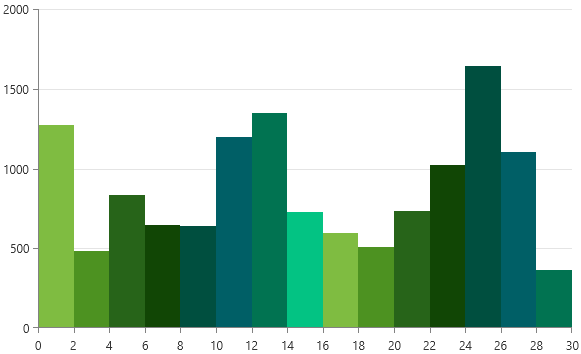
The interval between the bars is calculated automatically. To set an explicit interval, use the Interval property of ChartHistogramSource.
Setting custom interval
<telerik:ChartHistogramSource x:Name="histogramSource"
                  ValueBinding="Value"
                  IntervalValueBinding="Interval"
                  ItemsSource="{Binding Items}"
                  Interval="2"/>
Setting the Bars Origin Value
By default the bars start drawing from the value of 0. To change this, set the OriginValue property of ChartHistogramSource.
Setting custom origin value
<telerik:ChartHistogramSource x:Name="histogramSource"
                  ValueBinding="Value"
                  IntervalValueBinding="Interval"
                  ItemsSource="{Binding Items}"
                  OriginValue="250"/>
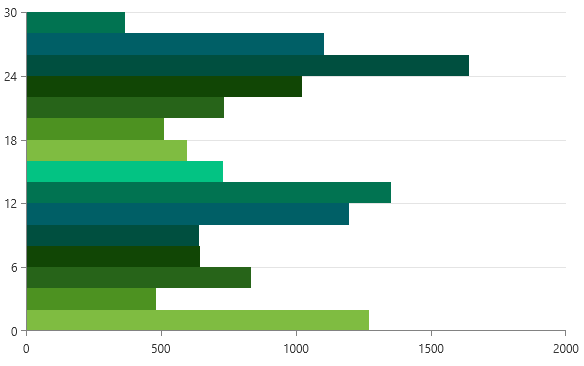
Setting the Histogram Orientation
By default, the bars will be arranged on the horizontal axis of the chart. This can be changed by setting the Orientation property of ChartHistogramSource to Vertical. This will arrange the bars on the vertical axis.
Setting the histogram data orientation
<telerik:ChartHistogramSource x:Name="histogramSource"
                      ValueBinding="Value"
                  IntervalValueBinding="Interval"
                  ItemsSource="{Binding Items}"
                  Orientation="Vertical"/>
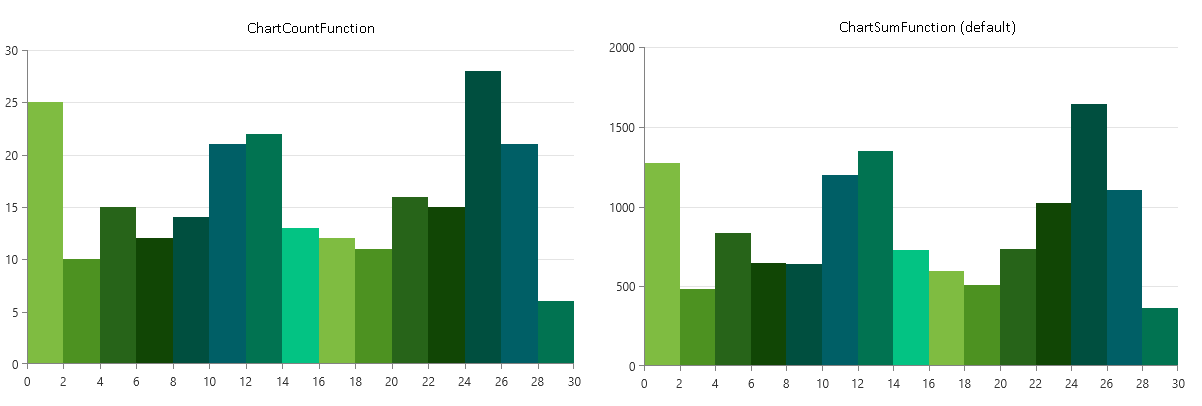
Changing the Aggregate Function
The ChartHistogramSource uses Count or Sum functions to aggregate the bar values. The Count function is used if the ItemsSource of the source is set to a colleciton of numbers. Sum is used when the source is assigned a collection of complex objects.
The aggregate function can be changed by overridding the GetValueAggregateFunction method of CustomChartHistogramSource. The method should return an object of type ChartAggregateFunction.
Replacing the aggregate function
public class CustomChartHistogramSource : ChartHistogramSource
{
        protected override ChartAggregateFunction GetValueAggregateFunction()
        {
                return new ChartCountFunction();
        }
}
Using the custom histogram source
<local:CustomChartHistogramSource x:Name="histogramSource"
                  ValueBinding="Value"
                  IntervalValueBinding="Interval"
                  ItemsSource="{Binding Items}"/>
The chart provides the following functions:
ChartAverageFunctionChartCountFunctionChartMaxFunctionChartMinFunctionChartSumFunctionKeepExtremesFunctionMemberFirstFunctionMemberLastFunction