.NET MAUI Chart Candlestick Series
The Cartesian Chart visualizes each data point from the Candlestick Series as a visual that resembles a candlestick. This is a typical financial series that can be used to visualize the state of a market for a period of time. The series operates with a special data in the form of four parameters defining the stock market - open, high, low, and close. The high and low values show the price range (the highest and lowest prices) over one unit of time. The open and close values indicate the opening and closing price of the stock for the corresponding period
Example
The following example shows how to create a basic RadCartesianChart with a Candlestick Series in XAML and C#.
1. Define the RadCartesianChart.
- XAML
<telerik:RadCartesianChart PaletteName="Light"
                        SelectionPaletteName="LightSelected"
                        BackgroundColor="White" >
    <telerik:RadCartesianChart.BindingContext>
        <local:SeriesOhlcViewModel />
    </telerik:RadCartesianChart.BindingContext>
    <telerik:RadCartesianChart.HorizontalAxis>
        <telerik:DateTimeContinuousAxis LineColor="#A9A9A9"
                                     LabelFitMode="Rotate"
                                     LabelFormat="MMM"
                                     PlotMode="BetweenTicks"
                                     MajorStepUnit="Month"/>
    </telerik:RadCartesianChart.HorizontalAxis>
    <telerik:RadCartesianChart.VerticalAxis>
        <telerik:NumericalAxis LineColor="#A9A9A9"
                            MajorTickBackgroundColor="#A9A9A9" />
    </telerik:RadCartesianChart.VerticalAxis>
    <telerik:RadCartesianChart.Series>
        <telerik:CandlestickSeries CategoryBinding="Category"
                                OpenBinding="Open"
                                HighBinding="High"
                                LowBinding="Low"
                                CloseBinding="Close"
                                ItemsSource="{Binding SeriesData}" />
    </telerik:RadCartesianChart.Series>
</telerik:RadCartesianChart>
2. Define the business model:
- C#
public class OhlcDataPoint : NotifyPropertyChangedBase
{
    private DateTime category;
    private double open;
    private double high;
    private double low;
    private double close;

    public DateTime Category
    {
        get { return this.category; }
        set
        {
            if (value != this.category)
            {
                this.category = value;
                this.OnPropertyChanged();
            }
        }
    }

    public double Open
    {
        get { return this.open; }
        set
        {
            if (value != this.open)
            {
                this.open = value;
                this.OnPropertyChanged();
            }
        }
    }

    public double High
    {
        get { return this.high; }
        set
        {
            if (value != this.high)
            {
                this.high = value;
                this.OnPropertyChanged();
            }
        }
    }

    public double Low
    {
        get { return this.low; }
        set
        {
            if (value != this.low)
            {
                this.low = value;
                this.OnPropertyChanged();
            }
        }
    }

    public double Close
    {
        get { return this.close; }
        set
        {
            if (value != this.close)
            {
                this.close = value;
                this.OnPropertyChanged();
            }
        }
    }
}
3. And the ViewModel:
- C#
public class ViewModel
{
public ViewModel()
{
this.SeriesData = LoadData();
}
public ObservableCollection<OhlcDataPoint> SeriesData { get; private set; }
public ObservableCollection<OhlcDataPoint> LoadData()
{
ObservableCollection<OhlcDataPoint> points = new ObservableCollection<OhlcDataPoint>();
points.Add(new OhlcDataPoint(){ Category = DateTime.ParseExact("03-01-2011", "dd-MM-yyyy", null), Open = 325.64, High = 330.26, Low = 324.84, Close = 329.57 });
points.Add(new OhlcDataPoint(){ Category = DateTime.ParseExact("04-01-2011", "dd-MM-yyyy", null), Open = 332.44, High = 332.50, Low = 328.15, Close = 331.29 });
points.Add(new OhlcDataPoint(){ Category = DateTime.ParseExact("06-01-2011", "dd-MM-yyyy", null), Open = 329.55, High = 334.34, Low = 329.50, Close = 334.00 });
points.Add(new OhlcDataPoint(){ Category = DateTime.ParseExact("07-01-2011", "dd-MM-yyyy", null), Open = 334.72, High = 335.25, Low = 332.90, Close = 333.73 });
points.Add(new OhlcDataPoint(){ Category = DateTime.ParseExact("10-01-2011", "dd-MM-yyyy", null), Open = 333.99, High = 336.35, Low = 331.90, Close = 336.12 });
points.Add(new OhlcDataPoint(){ Category = DateTime.ParseExact("11-01-2011", "dd-MM-yyyy", null), Open = 338.83, High = 343.23, Low = 337.17, Close = 342.45 });
points.Add(new OhlcDataPoint(){ Category = DateTime.ParseExact("12-01-2011", "dd-MM-yyyy", null), Open = 344.88, High = 344.96, Low = 339.47, Close = 341.64 });
points.Add(new OhlcDataPoint(){ Category = DateTime.ParseExact("13-01-2011", "dd-MM-yyyy", null), Open = 343.25, High = 344.43, Low = 342.00, Close = 344.42 });
points.Add(new OhlcDataPoint(){ Category = DateTime.ParseExact("14-01-2011", "dd-MM-yyyy", null), Open = 345.16, High = 346.64, Low = 343.85, Close = 345.68 });
points.Add(new OhlcDataPoint(){ Category = DateTime.ParseExact("18-01-2011", "dd-MM-yyyy", null), Open = 345.89, High = 348.48, Low = 344.44, Close = 348.48 });
points.Add(new OhlcDataPoint(){ Category = DateTime.ParseExact("19-01-2011", "dd-MM-yyyy", null), Open = 329.52, High = 344.76, Low = 326.00, Close = 340.65 });
points.Add(new OhlcDataPoint(){ Category = DateTime.ParseExact("20-01-2011", "dd-MM-yyyy", null), Open = 348.35, High = 348.60, Low = 336.88, Close = 338.84 });
points.Add(new OhlcDataPoint(){ Category = DateTime.ParseExact("21-01-2011", "dd-MM-yyyy", null), Open = 336.43, High = 338.30, Low = 330.12, Close = 332.68 });
points.Add(new OhlcDataPoint(){ Category = DateTime.ParseExact("24-01-2011", "dd-MM-yyyy", null), Open = 333.77, High = 334.88, Low = 326.63, Close = 326.72 });
points.Add(new OhlcDataPoint(){ Category = DateTime.ParseExact("25-01-2011", "dd-MM-yyyy", null), Open = 326.87, High = 337.45, Low = 326.72, Close = 337.45 });
points.Add(new OhlcDataPoint(){ Category = DateTime.ParseExact("26-01-2011", "dd-MM-yyyy", null), Open = 336.33, High = 341.44, Low = 334.57, Close = 341.40});
points.Add(new OhlcDataPoint(){ Category = DateTime.ParseExact("27-01-2011", "dd-MM-yyyy", null), Open = 342.96, High = 345.60, Low = 341.50, Close = 343.85 });
points.Add(new OhlcDataPoint(){ Category = DateTime.ParseExact("28-01-2011", "dd-MM-yyyy", null), Open = 343.78, High = 344.69, Low = 342.83, Close = 343.21 });
points.Add(new OhlcDataPoint(){ Category = DateTime.ParseExact("31-01-2011", "dd-MM-yyyy", null), Open = 344.17, High = 344.40, Low = 333.53, Close = 336.10 });
points.Add(new OhlcDataPoint(){ Category = DateTime.ParseExact("02-02-2011", "dd-MM-yyyy", null), Open = 335.8, High = 340.04, Low = 334.30, Close = 339.32 });
points.Add(new OhlcDataPoint(){ Category = DateTime.ParseExact("03-02-2011", "dd-MM-yyyy", null), Open = 343.8, High = 344.24, Low = 338.55, Close = 343.44 });
return points;
}
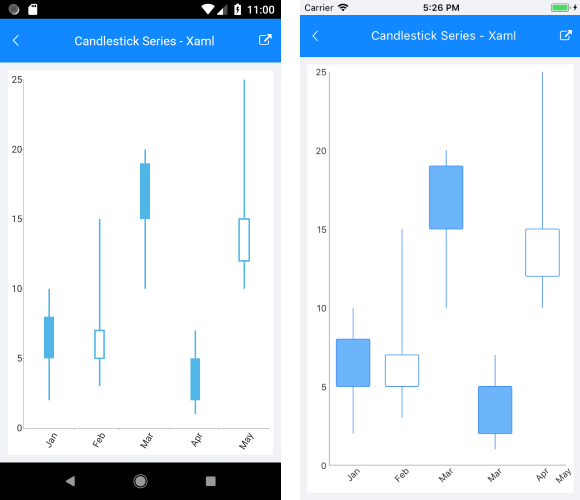
}The following image shows the end result: