.NET MAUI Chart Axes
The Cartesian Chart plots data points in a coordinate system defined by its two axes. Instead of having one axis type that tries to represent various types of information, the two axes provide a hierarchy where each concrete axis type exposes a specific functionality.
The Axes is part of Telerik UI for .NET MAUI, the most comprehensive UI suite for .NET MAUI! To try it out, sign up for a free 30-day trial and kickstart your cross-platform app development today.
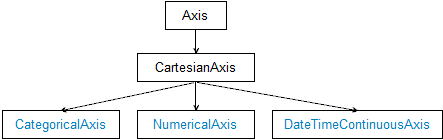
The predefined axis types are:
Common Axis Features
The common axis functionality is encapsulated by the abstract Axis class and handles displaying ticks that mark values on the axis at fixed positions. The axis also displays labels that are used to provide a visualization of the values at some or all the ticks. The default visualization of the labels is text, and the default visuals created internally are text blocks.
The following sections list all the properties exposed by the base axis type.
Label Style and Position
You can customize the labels orientation and style with the following properties:
-
LabelFitMode—Specifies how labels that exceed the axis bounding rectangle will be positioned. The available fit options are:-
MultiLine—Arranges axis labels on multiple lines with each label located on a line different from its neighbor labels. -
Rotate—Arranges the axis labels so that they are rotated some degrees around their top left corner.
-
-
LabelFontSize—Specifies the font size of the labels. -
LabelTextColor—Specifies the color of the labels.
The following example demonstrates how to define the LabelFitMode and the font size and color of the label.
Label Format
You can customize the labels text with the following properties:
-
LabelFormat—Provides a format string that will be used when converting the label value to a string. Each axis type requires different format:-
NumericalAxis—Any numeric format like"N","P2". -
DateTimeContinuousAxis—Any date format like"dd-MM-yy","HH:mm". -
CategoricalAxis—"{0} items","{0:N}".
-
-
LabelFormatter—Specifies a custom formatter that implements theILabelFormatterinterface to apply a custom rule for setting each label text.
The following example shows how to set LabelFormat to a Numerical Axis:
Label Formatter
The LabelFormatterBase<T> class is a base implementation of the ILabelFormatter interface that can be used in the most common scenarios.
The following example shows how to set a label formatter for the Date-Time Continuous Axis.
You can apply it in the following way:
Styling the Axis Line and Ticks
You can customize the appearance of the axis line and ticks with the following properties:
-
MajorTickBackgroundColor—Specifies the major ticks color. -
MajorTickThickness—Specifies the thickness of the major ticks. -
LineColor—Specifies the color of the axis line. -
LineDashArray—Specifies the array that is used to create a dash line, which will be applied to the axis line.
The following example demonstrates how to define the major ticks color and set their thickness and line color.
Location
You can specify the location of the axis with the following properties:
-
HorizontalLocation—Specifies the horizontal location of the axis. Applicable for vertical axes. -
VerticalLocation—Specifies the vertical location of the axis. Applicable for horizontal axes.
The following example demonstrates how to set a vertical location for the axis.