Troubleshoot My Failing Test
Test Studio has built-in mechanisms to help you identify the weak spots in your tests. In the case of a step failure you can find thorough details about what caused it.
The Quick Test Execution mode in Test Studio gives different options for troubleshooting a failing test. This article will guide you through the available tools, when these are helpful or applicable and how to get the most of each.
Execution Log on Failure
Although the execution log generated in the quick run mode, is a temporary available resource, it contains a bunch of useful details to help you analyze why a test may be failing.
It represents a list of the steps in the executed test including test as steps, noting which of these were run, and if they passed or failed. And in case of failure, there is detailed information for the error, which led to it.
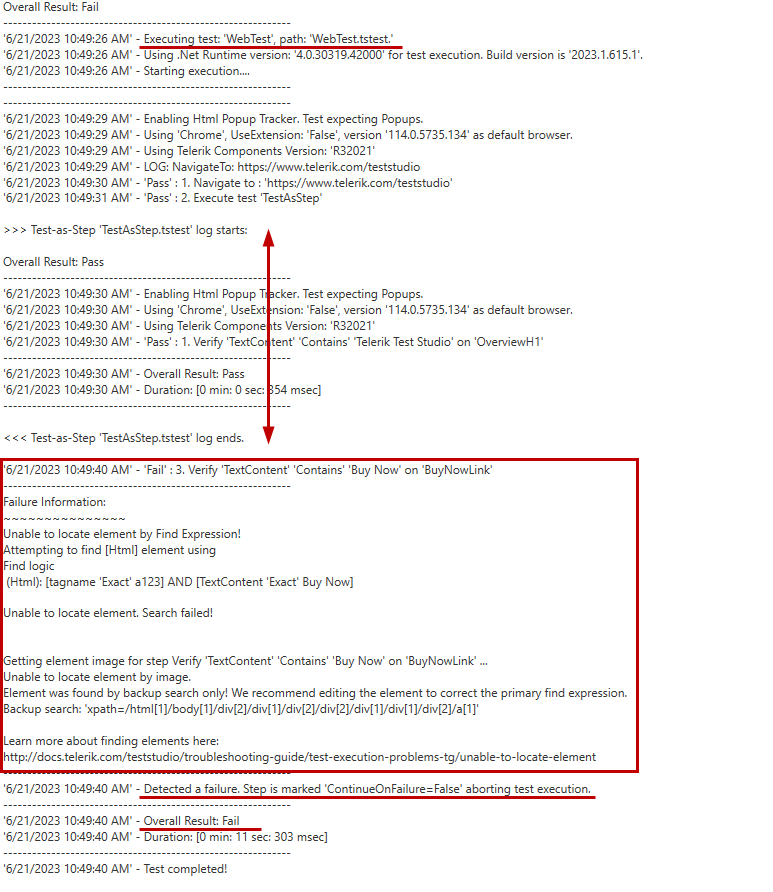
The execution log also keeps information for the browser used for the run, the test, which was executed, the current version of Test Studio, etc.
What to Look for in the Execution Log on Failure?
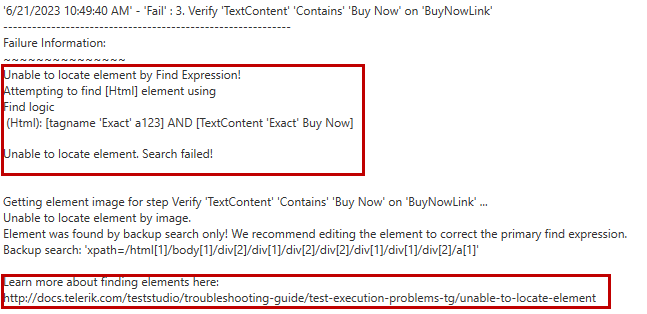
When a test failed, check the failure information listed under the faulty step. In most cases the information listed there is quite descriptive and helps you find the root cause of the failure. If we focus on the above example, it says the element in step 5. cannot be found on page. On top of this the element's find expression is listed, if the image search was used, and at the bottom you can even find a link to the documentation about the topic how elements are located in Test Studio.
Tip
Before you try to change the find expression for the missing element, check the images on failure from the Step Failure details and ensure the test has reached the page you expect to find the missing element on.
Step Failure Details
The Step Failure Details dialog is only available in the case of a failing test. It provides a full stack of information to help analyzing and resolving a failing step.
Failure Details Tab
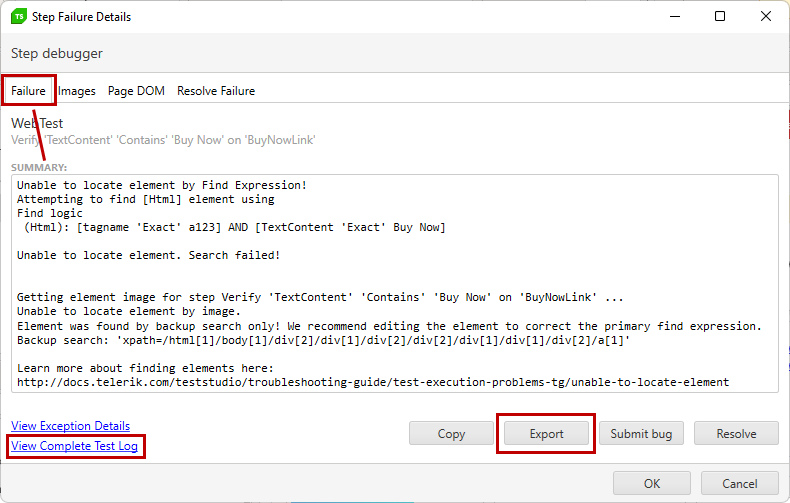
The first tab of these details lists the exact error, which caused the failure, and provides access to the full execution log.
Tip
From this tab you can also export a zipped folder with all failure details, if you need to provide this to a colleague or the Test Studio Support team.
Expected Vs. Actual Images Tab
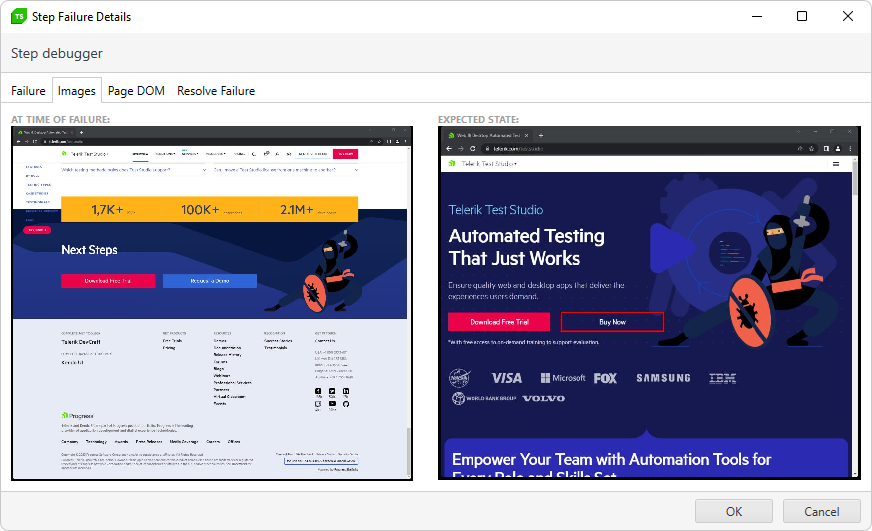
The Images tab provides a visual representation of the tested page at the time of failure. This is how you can easily sort out if the page is the one you expected - it could have changed due to an application update, or the previous steps in the test did not manage to perform correctly and navigate the page to the desired state.
Tip
If the page is not the expected one, but there were no recent changes in the application, probably you need to slow down the test steps execution, so that these can be executed when the page is ready to respond. The mechanisms in Test Studio to sync the speed of execution and application responsiveness are the wait and verification steps, and/or execution delays.
DOM Tree On Failure
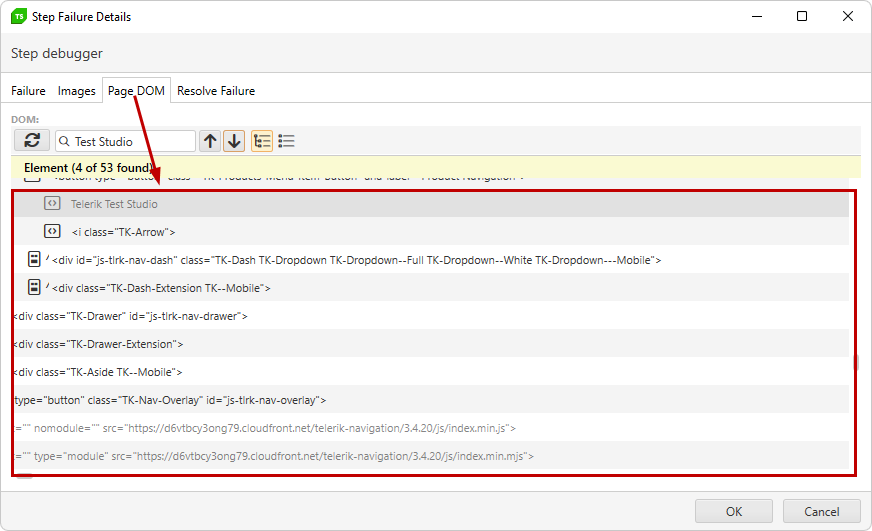
The Page DOM tab provides a snippet of how Test Studio sees the DOM of the page at the time of failure. You can inspect the overall structure of the page in the DOM, or search for particular element. It can be useful in all cases, when the failure is related to an element state - among these can be either if the element cannot be found, or is reported that does not exist, or a test times out waiting for an element, or the test targets incorrect element.
Tip
If you need to explore the DOM tree in actual test runtime, you can use the Visual Debugger. If you need to explore the DOM tree in a recording session, you can use the DOM Explorer in the Advanced Recording Tools window.
Resolve Failure
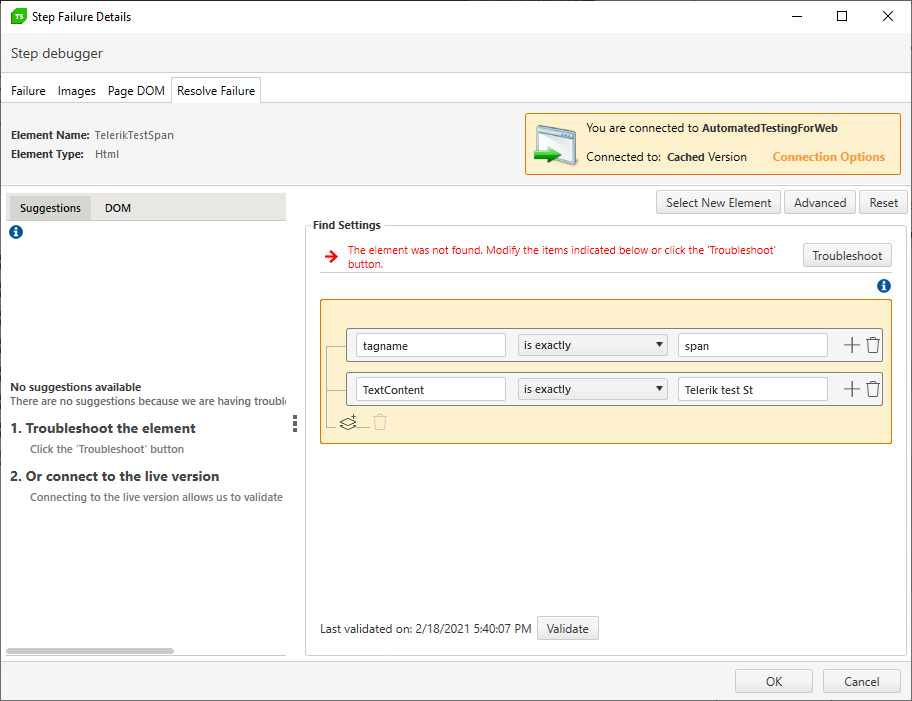
The Resolve Failure tab from the Failure details includes a particular suggestion tailored based on the actual error. Therefore it will present different information for the various failures, you may encounter and you can follow the suggested steps to apply the resolution.
Visual Debugger
The Visual Debugger is a useful tool, which allows you to debug a test during its execution. It appears for each quick test execution at the bottom right corner of the active display (right above the Windows system tray) and shows the progress of the executed steps. From the Visual Debugger toolbar you can manually pause the test run, or adjust its settings to automatically pause on specific errors. You can also set a breakpoint on particular step and force the test execution to pause on that step.
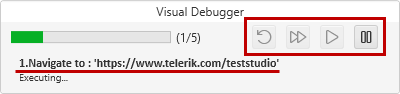
Once the test is paused in run-time, you can inspect the current DOM of the page, take a snippet of the DOM and screenshot of the page, access the execution log of the steps executed so far, diagnose the current failed step, if applicable, and even report a bug in case there is a bug tracker configured for the project. Once you explore the necessary details for the failure, you can continue the test execution until the end, or with a single step run at a time. You can also choose to rerun the current step.

Test Studio Application Log
The application log is a record of log messages recorded by Test Studio throughout your interactions in the product. All records in the application log are added to indicate important events and help pinpoint where problems may occur. This log is distinct from the execution log, which only records the attempted steps and encountered exceptions during test execution. The application log is useful for unexpected occurrences such as a product crash, unexpected termination of a test run, which might prevent generating the execution log, inconsistent behavior while working with the project components.
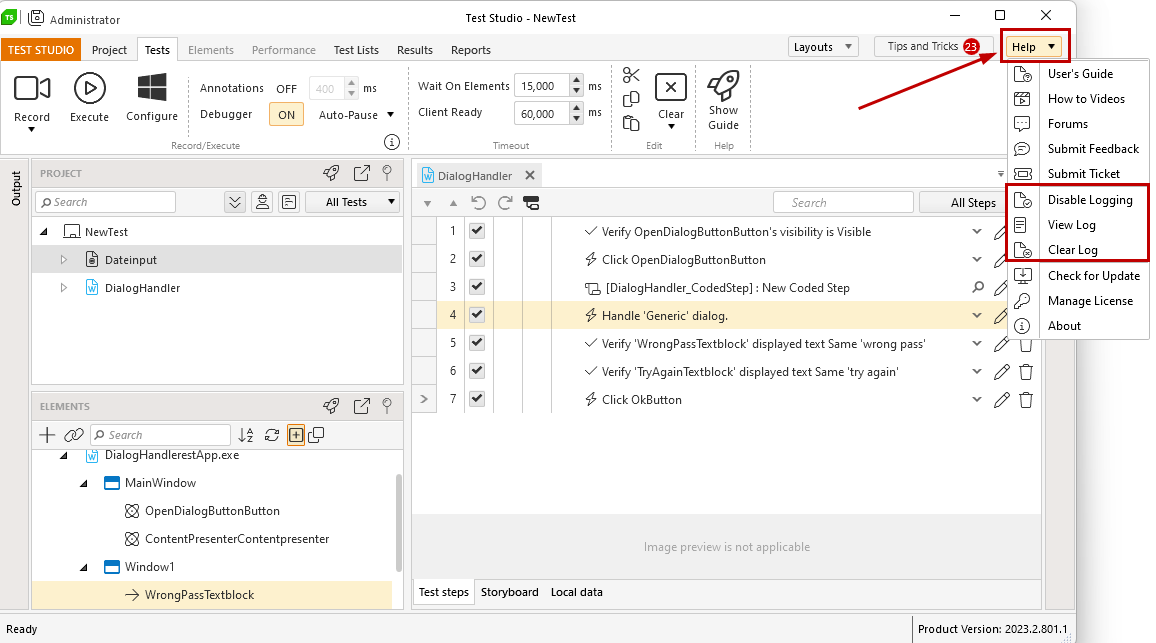
Follow the below steps to generate the logging and find the error message indicating the encountered issue:
- Clear the log file;
- Ensure logging is enabled;
- Reproduce the misbehavior to be investigated;
- Once the observed inconsistency is present, open the application log from the 'View Log' option;
- The logging records are opened in a text editor file (usually Notepad);
- You can revise the logged messages yourself and try to find a solution based on the error message.
- Or you can contact the Test Studio Support Team and send the zipped log file via a support thread describing the experienced issue.
When to turn on the application log?
Whenever Test Studio behaves differently than expected, an application log can give more information about why. This is especially true for situations other than test failure or code compilation. For example:
- Test Studio generates error messages;
- Test Studio closes unexpectedly;
- Test Studio stops responding;
- Test Studio interacts with other software (TeamPulse, TFS, QC) differently than expected;
- A Test Studio execution browser closes unexpectedly or stops responding during execution;
- Test Studio cannot connect to a browser.
Generating the application log
Test Studio logging options can be accessed from different components of the product. Find out how to generate the application log for the different installations of Test Studio.
What to look for in the application log.
The application log can be useful in many ways to Test Studio support engineers and developers. Users with issues should look for exceptions.
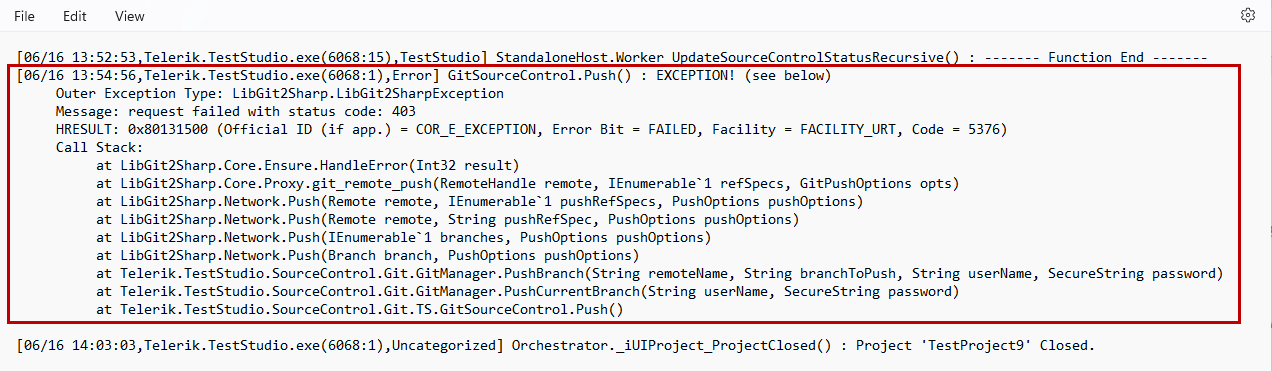
These are usually accompanied with error messages that may guide you in troubleshooting. If you are not familiar with the error message, try searching our documentation for it. If you still cannot understand the error, consider attaching a copy of the log to a support ticket.