Candlestick Series
Overview
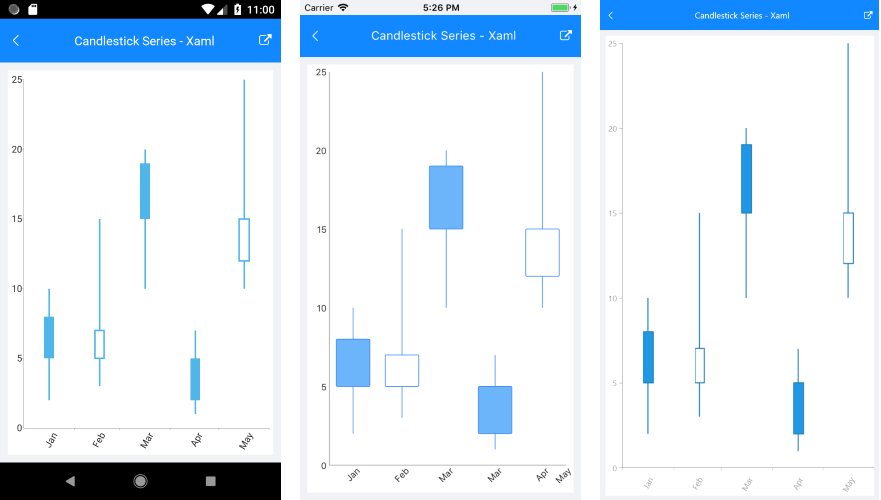
RadCartesianChart visualizes each data point from the CandlestickSeries as a visual that resembles a candlestick. This is a typical financial series that can be used to visualize the state of a market for a period of time. The series operates with a special kind of data in the form of four parameters defining the stock market - open, high, low, and close. The high and low values show the price range (the highest and lowest prices) over one unit of time. The open and close values indicate the opening and closing price of the stock for the corresponding period
Example
Here is an example of how to create a basic RadCartesianChart with CandlestickSeries in XAML and C#:
<telerikChart:RadCartesianChart PaletteName="Light"
                                SelectionPaletteName="LightSelected"
                                BackgroundColor="White" >
    <telerikChart:RadCartesianChart.BindingContext>
        <local:ViewModel />
    </telerikChart:RadCartesianChart.BindingContext>
    <telerikChart:RadCartesianChart.HorizontalAxis>
        <telerikChart:DateTimeContinuousAxis LineColor="#A9A9A9"
                                             LabelFitMode="Rotate"
                                             LabelFormat="MMM"
                                             PlotMode="BetweenTicks"
                                             MajorStepUnit="Month"/>
    </telerikChart:RadCartesianChart.HorizontalAxis>
    <telerikChart:RadCartesianChart.VerticalAxis>
        <telerikChart:NumericalAxis LineColor="#A9A9A9"
                                    MajorTickBackgroundColor="#A9A9A9" />
    </telerikChart:RadCartesianChart.VerticalAxis>
    <telerikChart:RadCartesianChart.Series>
        <telerikChart:CandlestickSeries CategoryBinding="Category"
                                        OpenBinding="Open"
                                        HighBinding="High"
                                        LowBinding="Low"
                                        CloseBinding="Close"
                                        ItemsSource="{Binding SeriesData}" />
    </telerikChart:RadCartesianChart.Series>
</telerikChart:RadCartesianChart>
var chart = new RadCartesianChart
{
    BackgroundColor = Color.White,
    BindingContext = new ViewModel(),
    HorizontalAxis = new DateTimeContinuousAxis()
    {
        LabelFitMode = AxisLabelFitMode.Rotate,
        PlotMode = AxisPlotMode.BetweenTicks,
        MajorStepUnit = TimeInterval.Month,
        LabelFormat = "MMM"
    },
    VerticalAxis = new NumericalAxis()
    {
        LineColor = Color.FromHex("#A9A9A9"),
        MajorTickBackgroundColor = Color.FromHex("#A9A9A9")
    },
    Series =
    {
        new CandlestickSeries
        {
           CategoryBinding = new PropertyNameDataPointBinding("Category"),
           OpenBinding = new PropertyNameDataPointBinding("Open"),
           HighBinding = new PropertyNameDataPointBinding("High"),
           LowBinding = new PropertyNameDataPointBinding("Low"),
           CloseBinding = new PropertyNameDataPointBinding("Close")
        }
    },
};

chart.Series[0].SetBinding(ChartSeries.ItemsSourceProperty, "SeriesData");
Add the following namespace:
xmlns:telerikChart="clr-namespace:Telerik.XamarinForms.Chart;assembly=Telerik.XamarinForms.Chart"
Here is how the business model is defined:
public class OhlcDataPoint : NotifyPropertyChangedBase
{
    private DateTime category;
    private double open;
    private double high;
    private double low;
    private double close;

    public DateTime Category
    {
        get { return this.category; }
        set
        {
            if (value != this.category)
            {
                this.category = value;
                this.OnPropertyChanged();
            }
        }
    }

    public double Open
    {
        get { return this.open; }
        set
        {
            if (value != this.open)
            {
                this.open = value;
                this.OnPropertyChanged();
            }
        }
    }

    public double High
    {
        get { return this.high; }
        set
        {
            if (value != this.high)
            {
                this.high = value;
                this.OnPropertyChanged();
            }
        }
    }

    public double Low
    {
        get { return this.low; }
        set
        {
            if (value != this.low)
            {
                this.low = value;
                this.OnPropertyChanged();
            }
        }
    }

    public double Close
    {
        get { return this.close; }
        set
        {
            if (value != this.close)
            {
                this.close = value;
                this.OnPropertyChanged();
            }
        }
    }
}
And here is the result:
SDK Browser application contains an example that shows how to use the CandlestickSeries. You can find the application in the Examples folder of your local Telerik UI for Xamarin installation.