ChartSelectionBehavior
Overview
ChartSelectionBehavior is responsible for selecting, deselecting and reporting the selection of either data points or series. In other words, the selection behavior can target data points, series or both if required.
With R2 2018 SP release Behaviors property of RadChart was replaced with ChartBehaviors. Behaviors property is marked as obsolete, so please use ChartBehaviors instead.
Features
Properties
-
DataPointSelectionMode: Gets or sets the ChartSelectionMode that controls the selection behavior of the data points within the chart series. The available values are:
- None
- Single
- Multiple
-
SeriesSelectionMode: Gets or sets the ChartSelectionMode that controls the selection behavior of the series within the plot area. The available values are:
- None
- Single
- Multiple
- SelectedPoints: Retrieves all the points from all series within the chart plot area that are currently selected.
- SelectedSeries: Retrieves all the series instances within the plot area that are currently selected.
Methods
- ClearSelecton() method : Removes the current selection within the chart.
Events
- SelectionChanged event: Occurs when a selection has been made.
Commands
ChartSelectionBehavior exposes support for Commands.
Example
Here is an example of how the Chart Selection Behavior works with Command:
First, create the needed business objects, for example:
public class CategoricalData
{
    public object Category { get; set; }

    public double Value { get; set; }
}
Then create a ViewModel:
public class ViewModel : NotifyPropertyChangedBase
{
    private int counter = 0;
    private string displayCount;
    public ObservableCollection<CategoricalData> Data1 { get; set; }
    public ObservableCollection<CategoricalData> Data2 { get; set; }
    public ICommand IsSelectionChangedCommand { get; }

    public ViewModel()
    {
        this.Data1 = GetCategoricalData1();
        this.Data2 = GetCategoricalData2();
        this.IsSelectionChangedCommand = new Command(this.IncreaseCount);
    }
    public int Counter
    {
        get
        {
            return this.counter;
        }
        set
        {
            this.counter = value;
            this.DisplayCount = $"Command executed {counter} times.";
        }
    }
    public string DisplayCount
    {
        get
        {
            return this.displayCount;
        }
        set
        {
            if (this.displayCount != value)
            {
                this.displayCount = value;
                this.OnPropertyChanged();
            }
        }
    }

    private static ObservableCollection<CategoricalData> GetCategoricalData1()
    {
        var data = new ObservableCollection<CategoricalData>
        {
            new CategoricalData { Category = "Greenings", Value = 52 },
            new CategoricalData { Category = "Perfecto", Value = 60 },
            new CategoricalData { Category = "NearBy", Value = 77 },
            new CategoricalData { Category = "Family", Value = 50 },
            new CategoricalData { Category = "Fresh", Value = 56 },
        };
        return data;
    }

    private static ObservableCollection<CategoricalData> GetCategoricalData2()
    {
        var data = new ObservableCollection<CategoricalData>
        {
            new CategoricalData { Category = "Greenings", Value = 33 },
            new CategoricalData { Category = "Perfecto", Value = 88 },
            new CategoricalData { Category = "NearBy", Value = 61 },
            new CategoricalData { Category = "Family", Value = 94 },
            new CategoricalData { Category = "Fresh", Value = 72 },
        };
        return data;
    }
    private void IncreaseCount()
    {
        this.Counter++;
    }
}
Finally, use the following snippet to declare a RadCartesianChart in XAML and in C#:
<ContentView.BindingContext>
    <local:ViewModel/>
</ContentView.BindingContext>
<Grid>
    <Grid.RowDefinitions>
        <RowDefinition />
        <RowDefinition Height="Auto" />
        <RowDefinition Height="0.3*"/>
    </Grid.RowDefinitions>

    <telerikChart:RadCartesianChart Grid.Row="0">
        <telerikChart:RadCartesianChart.HorizontalAxis>
            <telerikChart:CategoricalAxis LabelFitMode="MultiLine" />
        </telerikChart:RadCartesianChart.HorizontalAxis>
        <telerikChart:RadCartesianChart.VerticalAxis>
            <telerikChart:NumericalAxis />
        </telerikChart:RadCartesianChart.VerticalAxis>
        <telerikChart:RadCartesianChart.Series>
            <telerikChart:BarSeries ValueBinding="Value"
                                CategoryBinding="Category"
                                CombineMode="Stack"
                                StackGroupKey="1"
                                AllowSelect="True"
                                ItemsSource="{Binding Data1}" />
            <telerikChart:BarSeries ValueBinding="Value"
                                CategoryBinding="Category"
                                CombineMode="Stack"
                                StackGroupKey="1"
                                AllowSelect="True"
                                ItemsSource="{Binding Data2}" />
        </telerikChart:RadCartesianChart.Series>
        <telerikChart:RadCartesianChart.ChartBehaviors>
            <telerikChart:ChartSelectionBehavior DataPointSelectionMode="Single"
                                                 Command="{Binding IsSelectionChangedCommand}"
                                                 SeriesSelectionMode="None" />
        </telerikChart:RadCartesianChart.ChartBehaviors>
    </telerikChart:RadCartesianChart>

    <Label Grid.Row="2" Text="{Binding DisplayCount}"/>
</Grid>
var chart = new RadCartesianChart
{
    BindingContext = new ViewModel(),
    PaletteName = PaletteNames.Light,
    SelectionPaletteName = PaletteNames.LightSelected,
    HorizontalAxis = new CategoricalAxis()
    {
        LabelFitMode = AxisLabelFitMode.MultiLine,
    },
    VerticalAxis = new NumericalAxis(),
    Series =
    {
        new BarSeries
        {
            ValueBinding = new PropertyNameDataPointBinding("Value"),
            CategoryBinding = new PropertyNameDataPointBinding("Category"),
            CombineMode = ChartSeriesCombineMode.Stack,
            StackGroupKey = 1,
            AllowSelect = true
        },
        new BarSeries
        {
            ValueBinding = new PropertyNameDataPointBinding("Value"),
            CategoryBinding = new PropertyNameDataPointBinding("Category"),
            CombineMode = ChartSeriesCombineMode.Stack,
            StackGroupKey = 1,
            AllowSelect = true
        }
    },
    ChartBehaviors =
    {
        new ChartSelectionBehavior
        {
            DataPointSelectionMode = ChartSelectionMode.Single,
            SeriesSelectionMode = ChartSelectionMode.None
        }
    }
};

chart.Series[0].SetBinding(ChartSeries.ItemsSourceProperty, "Data1");
chart.Series[1].SetBinding(ChartSeries.ItemsSourceProperty, "Data2");
Where the telerikChart namespace is the following:
xmlns:telerikChart="clr-namespace:Telerik.XamarinForms.Chart;assembly=Telerik.XamarinForms.Chart"
using Telerik.XamarinForms.Chart;
Here is how the selection looks:
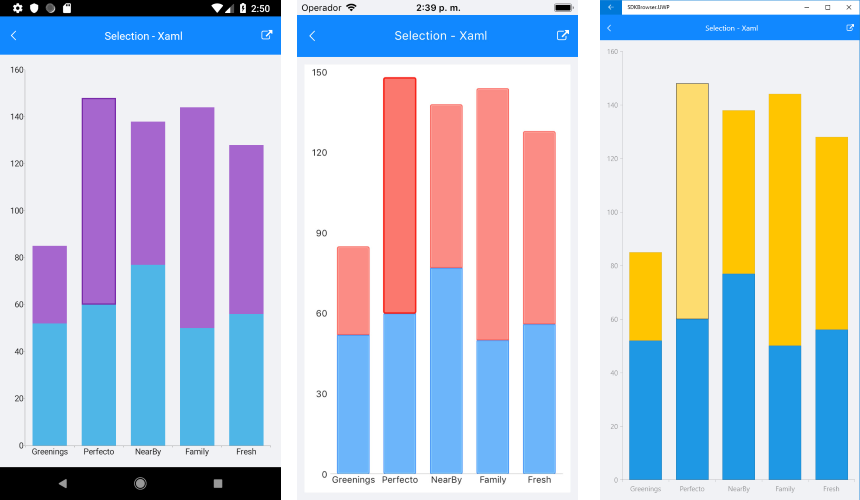
A sample Selection example can be found in the Chart/Interactivity folder of the SDK Samples Browser application.