Data Binding
When displaying a map, you might also want to visualize some data on it in the form of hot spots, pin points, etc. As showed in the topics under the Information Layer section, you can declare them as static objects. However, the InformationLayer object allows you to dynamically load and display map markers via data binding.
To learn more about the InformationLayer class and its usage read this topic.
In order to display your map data dynamically you just have to treat the InformationLayer as a typical ItemsControl. This means you have to use its ItemsSource and ItemTemplate properties. You can also make a use of the ItemTemplateSelector property, in order to implement advanced visualization depending on the data item.
There are two approaches you can use:
Using Data Binding in the DataTemplate
When loading your map data dynamically there are several attached properties that you can use in order to position and display the marker on its proper place:
MapLayer.Location - represents the latitude and the longitude of the map point.
MapLayer.BaseZoomLevel - represents the zoom level of the map for which the marker should have its normal size.
MapLayer.ZoomRange - represents a range of zoom levels on which the marker should appear.
To learn more about the usage of these properties read this topic.
In order to provide the needed data to your RadMap control, you have to create a collection of business objects, which represent the desired data.
The business object and the sample data for this example can be found at the end of the topic.
The next step is to define the ItemTemplate for the information layer and set the desired bindings in it. In the current example, the marker will be represented by an ellipse marked as a Hot Spot.
<telerik:RadMap x:Name="radMap"
                Width="600"
                Height="480">
    <telerik:InformationLayer x:Name="informationLayer">
        <telerik:InformationLayer.ItemTemplate>
            <DataTemplate>
                <Grid telerik:MapLayer.BaseZoomLevel="{Binding BaseZoomLevel}"
                        telerik:MapLayer.Location="{Binding Location}"
                        telerik:MapLayer.ZoomRange="{Binding ZoomRange}">
                    <telerik:MapLayer.HotSpot>
                        <telerik:HotSpot X="0.5"
                                            Y="0.5"
                                            ElementName="PART_Ellipse" />
                    </telerik:MapLayer.HotSpot>
                    <Ellipse x:Name="PART_Ellipse"
                                Width="20"
                                Height="20"
                                Stroke="Red"
                                StrokeThickness="3"
                                Fill="Transparent">
                        <ToolTipService.ToolTip>
                            <ToolTip Content="{Binding Caption}" />
                        </ToolTipService.ToolTip>
                    </Ellipse>
                </Grid>
            </DataTemplate>
        </telerik:InformationLayer.ItemTemplate>
    </telerik:InformationLayer>
</telerik:RadMap>
The last thing to do is to set the ItemsSource property of the InformationLayer. This has to be done after the initialization of the map provider, otherwise the marker elements will appear before the map has loaded. For this purpose you have to use the InitializationCompleted event, which get raised after the initialization of the map provider completes.
The code for the GetMapData() method can be found at the end of the topic.
public DataBindingSample()
{
    InitializeComponent();
    this.radMap.InitializeCompleted += radMap_InitializeCompleted;
}
void radMap_InitializeCompleted( object sender, EventArgs e )
{
    this.informationLayer.ItemsSource = this.GetMapData();
}
Public Sub New()
 InitializeComponent()
 Me.radMap.InitializeCompleted += radMap_InitializeCompleted
End Sub
Private Sub radMap_InitializeCompleted(sender As Object, e As EventArgs)
 Me.informationLayer.ItemsSource = Me.GetMapData()
End Sub
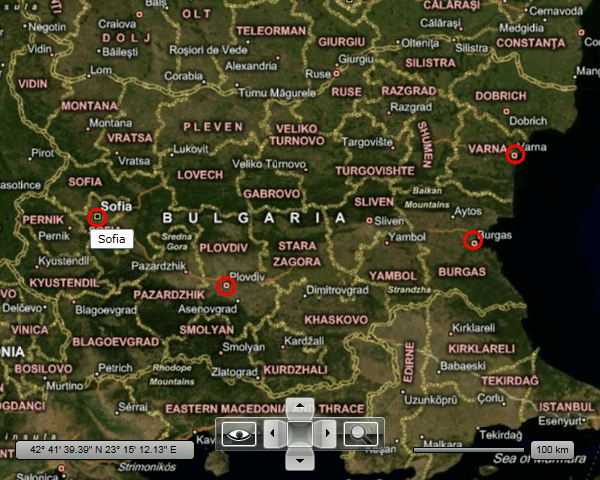
As a result you should be able to see the markers on your RadMap.
Using DataMappings
By using this approach you have to define mappings between the data fields and the respective MapLayer properties. This is done by creating the respective DataMapping objects and adding them to the DataMappings collection of the InformationLayer.
The DataMember enumeration used for the ValueMember value allows you to map not only the Location, ZoomLevel and ZoomRange. You can also map Latitude, Longitude, ZoomRangeMin and ZoomRangeMax. Which means that your business object can provide simple double properties for these values instead of the complex Location and ZoomRange ones.
In this example, the same ItemTemplate, business object and sample data will be used as in the example from the previous section of this topic.
The code for the business object and for the sample data can be found at the end of the topic.
To learn how and when to set the ItemsSource of the InformationLayer, please read the previous section.
<telerik:RadMap x:Name="radMap"
                Width="600"
                Height="480">
    <telerik:InformationLayer x:Name="informationLayer">
        <telerik:InformationLayer.DataMappings>
            <telerik:DataMapping FieldName="Location"
                                    ValueMember="Location" />
            <telerik:DataMapping FieldName="BaseZoomLevel"
                                    ValueMember="ZoomLevel" />
            <telerik:DataMapping FieldName="ZoomRange"
                                    ValueMember="ZoomRange" />
        </telerik:InformationLayer.DataMappings>
        <telerik:InformationLayer.ItemTemplate>
            <DataTemplate>
                <Grid>
                    <telerik:MapLayer.HotSpot>
                        <telerik:HotSpot X="0.5"
                                            Y="0.5"
                                            ElementName="PART_Ellipse" />
                    </telerik:MapLayer.HotSpot>
                    <Ellipse x:Name="PART_Ellipse"
                                Width="20"
                                Height="20"
                                Stroke="Red"
                                StrokeThickness="3"
                                Fill="Transparent">
                        <ToolTipService.ToolTip>
                            <ToolTip Content="{Binding Caption}" />
                        </ToolTipService.ToolTip>
                    </Ellipse>
                </Grid>
            </DataTemplate>
        </telerik:InformationLayer.ItemTemplate>
    </telerik:InformationLayer>
</telerik:RadMap>
Finally here is the code for the business object and the GetMapData() method.
public class MapItem
{
    public MapItem( string caption, Location location, double baseZoomLevel, ZoomRange zoomRange )
    {
        this.Caption = caption;
        this.Location = location;
        this.BaseZoomLevel = baseZoomLevel;
        this.ZoomRange = zoomRange;
    }
    public string Caption
    {
        get;
        set;
    }
    public Location Location
    {
        get;
        set;
    }
    public double BaseZoomLevel
    {
        get;
        set;
    }
    public ZoomRange ZoomRange
    {
        get;
        set;
    }
}
Public Class MapItem
 Public Sub New(caption As String, location As Location, baseZoomLevel As Double, zoomRange As ZoomRange)
  Me.Caption = caption
  Me.Location = location
  Me.BaseZoomLevel = baseZoomLevel
  Me.ZoomRange = zoomRange
 End Sub
 Public Property Caption() As String
  Get
   Return m_Caption
  End Get
  Set
   m_Caption = Value
  End Set
 End Property
 Private m_Caption As String
 Public Property Location() As Location
  Get
   Return m_Location
  End Get
  Set
   m_Location = Value
  End Set
 End Property
 Private m_Location As Location
 Public Property BaseZoomLevel() As Double
  Get
   Return m_BaseZoomLevel
  End Get
  Set
   m_BaseZoomLevel = Value
  End Set
 End Property
 Private m_BaseZoomLevel As Double
 Public Property ZoomRange() As ZoomRange
  Get
   Return m_ZoomRange
  End Get
  Set
   m_ZoomRange = Value
  End Set
 End Property
 Private m_ZoomRange As ZoomRange
End Class
private ObservableCollection<MapItem> GetMapData()
{
    ObservableCollection<MapItem> data = new ObservableCollection<MapItem>();
    data.Add( new MapItem( "Sofia", new Location( 42.6957539183824, 23.3327663758679 ), 5, new ZoomRange( 5, 12 ) ) );
    data.Add( new MapItem( "Plovdiv", new Location( 42.1429369264591, 24.7498095849434 ), 5, new ZoomRange( 5, 12 ) ) );
    data.Add( new MapItem( "Burgas", new Location( 42.5131732087098, 27.4611884843576 ), 5, new ZoomRange( 5, 12 ) ) );
    data.Add( new MapItem( "Varna", new Location( 43.2073941930888, 27.9275176988258 ), 5, new ZoomRange( 5, 12 ) ) );
    return data;
}
Private Function GetMapData() As ObservableCollection(Of MapItem)
 Dim data As New ObservableCollection(Of MapItem)()
 data.Add(New MapItem("Sofia", New Location(42.6957539183824, 23.3327663758679), 5, New ZoomRange(5, 12)))
 data.Add(New MapItem("Plovdiv", New Location(42.1429369264591, 24.7498095849434), 5, New ZoomRange(5, 12)))
 data.Add(New MapItem("Burgas", New Location(42.5131732087098, 27.4611884843576), 5, New ZoomRange(5, 12)))
 data.Add(New MapItem("Varna", New Location(43.2073941930888, 27.9275176988258), 5, New ZoomRange(5, 12)))
 Return data
End Function