Binding with RadChartView
The reports generated by RadPivotGrid can be easily visualized in RadChartView. To do this, you simply need to assign a RadPivotGrid instance as a DataSource of RadChartView:
Setting RadChartView Data Source
this.radChartView1.DataSource = this.radPivotGrid1;
Me.radChartView1.DataSource = Me.radPivotGrid1
Figure 1: Associating a Chart
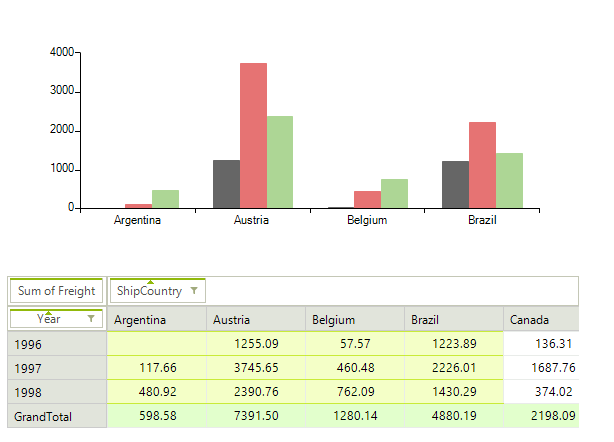
Populating RadChartView with data is performed by a PivotGridChartDataProvider object. It provides several properties for customizing its behavior. You can access this object by the ChartDataProvider property of RadPivotGrid.
Provider Settings
In some cases, including the SubTotal and GrandTotal values in the visualization is not needed as they can be simply the sum of all previous values. In this case, you can use the following properties to indicate which kind of totals to be displayed:
Totals Settings
this.radPivotGrid1.ChartDataProvider.IncludeColumnSubTotals = false;
this.radPivotGrid1.ChartDataProvider.IncludeRowSubTotals = false;
this.radPivotGrid1.ChartDataProvider.IncludeColumnGrandTotals = false;
this.radPivotGrid1.ChartDataProvider.IncludeRowSubTotals = false;
Me.radPivotGrid1.ChartDataProvider.IncludeColumnSubTotals = False
Me.radPivotGrid1.ChartDataProvider.IncludeRowSubTotals = False
Me.radPivotGrid1.ChartDataProvider.IncludeColumnGrandTotals = False
Me.radPivotGrid1.ChartDataProvider.IncludeRowSubTotals = False
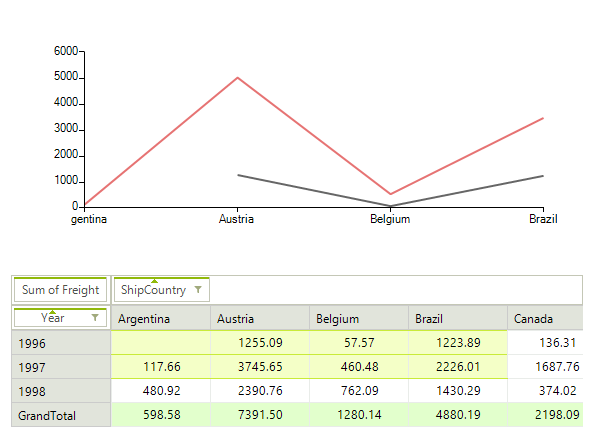
You can change the type of the generated series to one of the categorical types: Bar, Line, Area. Additionally, you can choose which of the pivot axes will be used for generating series:
RadChartView provides out of the box support for data points having null values. In order to enable it when associated with RadPivotGrid the EnableNulls property of the provider should be set to true.
Figure 2: Line Series with Null Values
Series Type
this.radPivotGrid1.ChartDataProvider.GeneratedSeriesType = Telerik.WinControls.UI.GeneratedSeriesType.Line;
this.radPivotGrid1.ChartDataProvider.SeriesAxis = Telerik.Pivot.Core.PivotAxis.Rows;
this.radPivotGrid1.ChartDataProvider.EnableNulls = true;
Me.radPivotGrid1.ChartDataProvider.GeneratedSeriesType = Telerik.WinControls.UI.GeneratedSeriesType.Line
Me.radPivotGrid1.ChartDataProvider.SeriesAxis = Telerik.Pivot.Core.PivotAxis.Rows
Me.radPivotGrid1.ChartDataProvider.EnableNulls = True
You have the option to choose whether the entire report should be visualized or only the selected parts of it. There is also an option to delay the updates so that RadChartView does not update constantly during selection.
Visualizing Data
this.radPivotGrid1.ChartDataProvider.SelectionOnly = true;
this.radPivotGrid1.ChartDataProvider.DelayUpdate = true;
this.radPivotGrid1.ChartDataProvider.DelayAmount = 500;
Me.radPivotGrid1.ChartDataProvider.SelectionOnly = True
Me.radPivotGrid1.ChartDataProvider.DelayUpdate = True
Me.radPivotGrid1.ChartDataProvider.DelayAmount = 500
You can change the delimiter that is put between the group names when generating chart categories. This can be useful for avoiding confusion if the default dash delimiter (“-“) is used in some of the group names.
Group Names Delimiter
this.radPivotGrid1.ChartDataProvider.GroupNameDelimiter = " -> ";
Me.radPivotGrid1.ChartDataProvider.GroupNameDelimiter = " -> "
PivotGridChartDataProvider Events
There are two events that allow you to modify the settings of the generated series or to use custom series. The SeriesCreating is fired when a series is being created and it allows you to replace the series instance with a custom one if needed. The UpdateCompleted event is fired when all series have been generated so that you can apply to them any final settings.
Chart Events
void ChartDataProvider_UpdateCompleted(object sender, EventArgs e)
{
    if (this.radPivotGrid1.ChartDataProvider.GeneratedSeriesType != GeneratedSeriesType.Bar)
    {
        foreach (CartesianSeries series in this.radChartView1.Series)
        {
            series.CombineMode = ChartSeriesCombineMode.Stack;
        }
    }
}
void ChartDataProvider_SeriesCreating(object sender, Telerik.WinControls.UI.SeriesCreatingEventArgs e)
{
    e.Series = new BarSeries();
}
Private Sub ChartDataProvider_UpdateCompleted(sender As Object, e As EventArgs)
    If Me.radPivotGrid1.ChartDataProvider.GeneratedSeriesType <> GeneratedSeriesType.Bar Then
        For Each series As CartesianSeries In Me.radChartView1.Series
            series.CombineMode = ChartSeriesCombineMode.Stack
        Next
    End If
End Sub
Private Sub ChartDataProvider_SeriesCreating(sender As Object, e As Telerik.WinControls.UI.SeriesCreatingEventArgs)
    e.Series = New BarSeries()
End Sub