Trackball
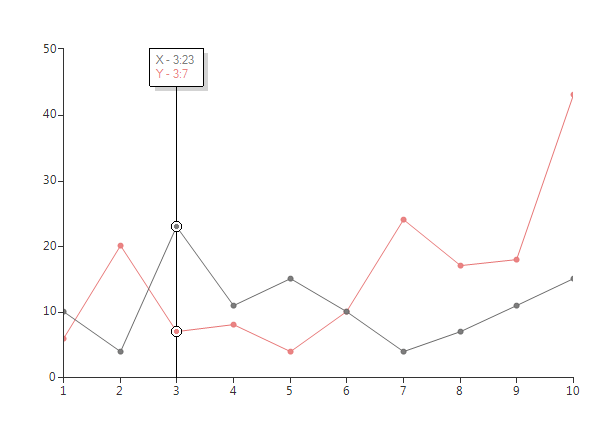
Along with tooltip and pan/zoom controllers, RadChartView provides a trackball behavior through the ChartTrackballController class. This controller can display a vertical line across the chart plot area and also to display little visual indicators (circles by default) at points where the trackball line crosses the visualization of a series object. For example when the trackball line crosses a line series line segment, a small circle is drawn highlighting the value of the series at this point. The last capability of the trackball behavior is to display a small popup, similar to the tooltip, in order to provide more detailed information about the closest points to the track ball line's cross section.
In order to utilize this behavior users simply have to add it to the chart's Controllers collection. For example:
Add Controller
radChartView1.Controllers.Add(new ChartTrackballController());
RadChartView1.Controllers.Add(New ChartTrackballController())
The ChartTrackballController will be added automatically if the ShowTrackBall property of RadChartView control is set to true:
Set Property
radChartView1.ShowTrackBall = true;
RadChartView1.ShowTrackBall = True
A sample is shown below:
Sample Setup
radChartView1.AreaType = ChartAreaType.Cartesian;
LineSeries lineSeries1 = new LineSeries();
lineSeries1.Name = "X";
lineSeries1.DataPoints.Add(new CategoricalDataPoint(10, "1"));
lineSeries1.DataPoints.Add(new CategoricalDataPoint(4, "2"));
lineSeries1.DataPoints.Add(new CategoricalDataPoint(23, "3"));
lineSeries1.DataPoints.Add(new CategoricalDataPoint(11, "4"));
lineSeries1.DataPoints.Add(new CategoricalDataPoint(15, "5"));
lineSeries1.DataPoints.Add(new CategoricalDataPoint(10, "6"));
lineSeries1.DataPoints.Add(new CategoricalDataPoint(4, "7"));
lineSeries1.DataPoints.Add(new CategoricalDataPoint(7, "8"));
lineSeries1.DataPoints.Add(new CategoricalDataPoint(11, "9"));
lineSeries1.DataPoints.Add(new CategoricalDataPoint(15, "10"));
radChartView1.Series.Add(lineSeries1);
LineSeries lineSeries2 = new LineSeries();
lineSeries2.Name = "Y";
lineSeries2.DataPoints.Add(new CategoricalDataPoint(6, "1"));
lineSeries2.DataPoints.Add(new CategoricalDataPoint(20, "2"));
lineSeries2.DataPoints.Add(new CategoricalDataPoint(7, "3"));
lineSeries2.DataPoints.Add(new CategoricalDataPoint(8, "4"));
lineSeries2.DataPoints.Add(new CategoricalDataPoint(4, "5"));
lineSeries2.DataPoints.Add(new CategoricalDataPoint(10, "6"));
lineSeries2.DataPoints.Add(new CategoricalDataPoint(24, "7"));
lineSeries2.DataPoints.Add(new CategoricalDataPoint(17, "8"));
lineSeries2.DataPoints.Add(new CategoricalDataPoint(18, "9"));
lineSeries2.DataPoints.Add(new CategoricalDataPoint(43, "10"));
radChartView1.Series.Add(lineSeries2);
radChartView1.ShowTrackBall = true;
RadChartView1.AreaType = ChartAreaType.Cartesian
Dim lineSeries1 As New LineSeries
lineSeries1.Name = "X"
lineSeries1.DataPoints.Add(New CategoricalDataPoint(10, "1"))
lineSeries1.DataPoints.Add(New CategoricalDataPoint(4, "2"))
lineSeries1.DataPoints.Add(New CategoricalDataPoint(23, "3"))
lineSeries1.DataPoints.Add(New CategoricalDataPoint(11, "4"))
lineSeries1.DataPoints.Add(New CategoricalDataPoint(15, "5"))
lineSeries1.DataPoints.Add(New CategoricalDataPoint(10, "6"))
lineSeries1.DataPoints.Add(New CategoricalDataPoint(4, "7"))
lineSeries1.DataPoints.Add(New CategoricalDataPoint(7, "8"))
lineSeries1.DataPoints.Add(New CategoricalDataPoint(11, "9"))
lineSeries1.DataPoints.Add(New CategoricalDataPoint(15, "10"))
RadChartView1.Series.Add(lineSeries1)
Dim lineSeries2 As New LineSeries
lineSeries1.Name = "Y"
lineSeries2.DataPoints.Add(New CategoricalDataPoint(6, "1"))
lineSeries2.DataPoints.Add(New CategoricalDataPoint(20, "2"))
lineSeries2.DataPoints.Add(New CategoricalDataPoint(7, "3"))
lineSeries2.DataPoints.Add(New CategoricalDataPoint(8, "4"))
lineSeries2.DataPoints.Add(New CategoricalDataPoint(4, "5"))
lineSeries2.DataPoints.Add(New CategoricalDataPoint(10, "6"))
lineSeries2.DataPoints.Add(New CategoricalDataPoint(24, "7"))
lineSeries2.DataPoints.Add(New CategoricalDataPoint(17, "8"))
lineSeries2.DataPoints.Add(New CategoricalDataPoint(18, "9"))
lineSeries2.DataPoints.Add(New CategoricalDataPoint(43, "10"))
RadChartView1.Series.Add(lineSeries2)
RadChartView1.ShowTrackBall = True
Figure 1: Trackball
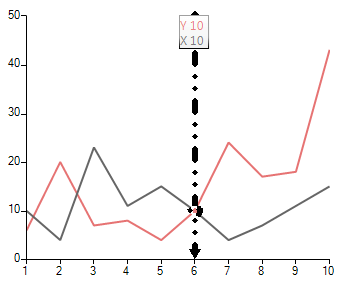
Customizing the Trackball
RadChartView provides a convenient way to control how the trackball is rendered. You can handle the PenInitialized event and customize the Pen object as follows:
            ChartTrackballController trackballController = new ChartTrackballController();
            trackballController.PenInitialized += trackballController_PenInitialized;
            radChartView1.Controllers.Add(trackballController);


        private void trackballController_PenInitialized(object sender, PenInitializedEventArgs e)
        {
            e.Pen.Width = 6;
            e.Pen.DashCap = System.Drawing.Drawing2D.DashCap.Triangle;
            e.Pen.DashStyle = System.Drawing.Drawing2D.DashStyle.DashDotDot;
            e.Pen.DashOffset = 50;
            e.Pen.StartCap = System.Drawing.Drawing2D.LineCap.DiamondAnchor;
            e.Pen.EndCap = System.Drawing.Drawing2D.LineCap.ArrowAnchor;
        }
        Dim trackballController As ChartTrackballController = New ChartTrackballController()
        AddHandler trackballController.PenInitialized, AddressOf trackballController_PenInitialized
        radChartView1.Controllers.Add(trackballController)


    Private Sub trackballController_PenInitialized(ByVal sender As Object, ByVal e As PenInitializedEventArgs)
        e.Pen.Width = 6
        e.Pen.DashCap = System.Drawing.Drawing2D.DashCap.Triangle
        e.Pen.DashStyle = System.Drawing.Drawing2D.DashStyle.DashDotDot
        e.Pen.DashOffset = 50
        e.Pen.StartCap = System.Drawing.Drawing2D.LineCap.DiamondAnchor
        e.Pen.EndCap = System.Drawing.Drawing2D.LineCap.ArrowAnchor
    End Sub
Figure 2: Customizing the Trackball