Drill down
The drill down functionality of a chart allows users to click on a graphical element (bar, pie segment etc.), representing some data, in order to navigate to another view which contains different data than the first one. The new view usually contains finer grained data like displaying information from yearly to quarterly data, from quarterly to monthly, etc., or in the case of a retail store from categories to brands, from brands to items, etc. The drill-down functionality basically makes your data points act like a hotspots for “drilling-down” or “zooming” into your data.
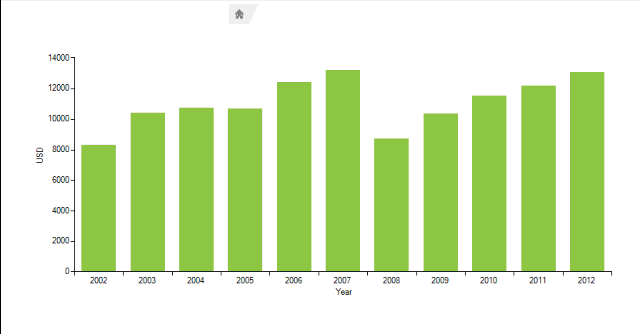
The animation below demonstrates how from BarSeries showing sales for 10 years as bars, when a bar is clicked you are navigated to another view showing BarSeries again, but this time displaying the sales for all months in the selected year. Clicking a month bar will produce another view, which displays line series with data for each day of the month.
Figure 1: Drill Down Functionality
To support this functionality a DrillDownControler should be used:
Add Controller
DrillDownController drillControler = new DrillDownController();
this.radChartView1.Controllers.Add(drillControler);
Dim drillControler As New DrillDownController()
Me.radChartView1.Controllers.Add(drillControler)
Then, you will need to add as many ChartViews as you need. Each ChartView represents different level of the drill operation.
Add Views
radChartView1.Views.AddNew("Revenue by Month");
radChartView1.Views.AddNew("Revenue by Day");
radChartView1.Views.AddNew("Revenue by Month")
radChartView1.Views.AddNew("Revenue by Day")
In order to show the added ChartViews you should set the ShowDrillNavigation property to true.
To handle the different levels, the Drill event should be used. Depending on the Level provided in the event arguments, you can decide how to setup the View. In the example below, different data is represented for Years, Months and Days:
Drill Event
int year, month;
void radChartView1_Drill(object sender, DrillEventArgs e)
{
    CartesianSeries series = new BarSeries();
    series.ValueMember = "Value";
    series.CategoryMember = "Date";
    DateTimeCategoricalAxis horizontalAxis = new DateTimeCategoricalAxis();
    LinearAxis verticalAxis = new LinearAxis();
    verticalAxis.AxisType = AxisType.Second;
    verticalAxis.Title = "USD";
    switch (e.Level)
    {
        case 0:
            series.DataSource = LoadDataByYears();
            horizontalAxis.LabelFormat = "{0:yyyy}";
            horizontalAxis.Title = "Year";
            break;
        case 1:
            if (e.SelectedPoint != null)
                year = ((DrillDownDataInfo)e.SelectedPoint.DataItem).Date.Year;
            horizontalAxis.LabelFormat = "{0:MM}";
            horizontalAxis.Title = "Month";
            e.View.Palette = KnownPalette.Metro;
            series.DataSource = ParseDataByMonth(year);
            break;
        case 2:
            if (e.SelectedPoint != null)
                month = ((DrillDownDataInfo)e.SelectedPoint.DataItem).Date.Month;
            series = new LineSeries();
            series.ValueMember = "Value";
            series.CategoryMember = "Date";
            series.DataSource = ParseDataByDay(year, month);
            series.ShowLabels = true;
            horizontalAxis.LabelFormat = "{0:dd}";
            horizontalAxis.Title = "Day";
            break;
    }
    e.View.Series.Clear();
    e.View.Axes.Clear();
    series.HorizontalAxis = horizontalAxis;
    series.VerticalAxis = verticalAxis;
    e.View.Series.Add(series);

    series.DrawLinesToLabels = true;
    series.BorderColor = series.BackColor = Color.FromArgb(142, 196, 65);
}
Private year As Integer, month As Integer
Private Sub radChartView1_Drill(sender As Object, e As DrillEventArgs)
    Dim series As CartesianSeries = New BarSeries()
    series.ValueMember = "Value"
    series.CategoryMember = "Date"
    Dim horizontalAxis As New DateTimeCategoricalAxis()
    Dim verticalAxis As New LinearAxis()
    verticalAxis.AxisType = AxisType.Second
    verticalAxis.Title = "USD"
    Select Case e.Level
        Case 0
            series.DataSource = LoadDataByYears()
            horizontalAxis.LabelFormat = "{0:yyyy}"
            horizontalAxis.Title = "Year"
            Exit Select
        Case 1
            If e.SelectedPoint IsNot Nothing Then
                year = DirectCast(e.SelectedPoint.DataItem, DrillDownDataInfo).[Date].Year
            End If
            horizontalAxis.LabelFormat = "{0:MM}"
            horizontalAxis.Title = "Month"
            e.View.Palette = KnownPalette.Metro
            series.DataSource = ParseDataByMonth(year)
            Exit Select
        Case 2
            If e.SelectedPoint IsNot Nothing Then
                month = DirectCast(e.SelectedPoint.DataItem, DrillDownDataInfo).[Date].Month
            End If
            series = New LineSeries()
            series.ValueMember = "Value"
            series.CategoryMember = "Date"
            series.DataSource = ParseDataByDay(year, month)
            series.ShowLabels = True
            horizontalAxis.LabelFormat = "{0:dd}"
            horizontalAxis.Title = "Day"
            Exit Select
    End Select
    e.View.Series.Clear()
    e.View.Axes.Clear()
    series.HorizontalAxis = horizontalAxis
    series.VerticalAxis = verticalAxis
    e.View.Series.Add(series)
    series.DrawLinesToLabels = True
    series.BorderColor = Color.FromArgb(142, 196, 65)
    series.BackColor = Color.FromArgb(142, 196, 65)
End Sub
If your chart is being oriented horizontally, please make sure that in the Drill event you are setting the correct axes as First and Second. In the example above, for a horizontally oriented view, the horizontal axis should be set as Second and the vertical axis should be set as First.
The navigation element’s text is taken from TitleElement.Text property by default, so every time you drill, you have to change this text accordingly. If this text is empty, it will be taken from the RadChartView.View.ViewName property.
To make the example complete you should make few more steps:
1. First you should create DrillDownDataInfo class which will contain two properties Value and Date and will implement the INotifyPropertyChanged interface:
Data Object
public class DrillDownDataInfo : INotifyPropertyChanged
{
    double value;
    DateTime date;
    public DrillDownDataInfo(DateTime date, double value)
    {
        this.date = date;
        this.value = value;
    }
    public double Value
    {
        get
        {
            return this.value;
        }
        set
        {
            this.value = value;
            this.OnPropertyChanged("Value");
        }
    }
    public DateTime Date
    {
        get
        {
            return this.date;
        }
        set
        {
            this.date = value;
            this.OnPropertyChanged("Date");
        }
    }
    public event PropertyChangedEventHandler PropertyChanged;
    public void OnPropertyChanged(string propertyName)
    {
        if (PropertyChanged != null)
        {
            PropertyChanged(this, new PropertyChangedEventArgs(propertyName));
        }
    }
}
Public Class DrillDownDataInfo
    Implements INotifyPropertyChanged
    Private m_value As Double
    Private m_date As DateTime
    Public Sub New([date] As DateTime, value As Double)
        Me.m_date = [date]
        Me.m_value = value
    End Sub
    Public Event PropertyChanged As PropertyChangedEventHandler Implements INotifyPropertyChanged.PropertyChanged
    Public Property Value() As Double
        Get
            Return Me.m_value
        End Get
        Set(value As Double)
            Me.m_value = value
            Me.OnPropertyChanged("Value")
        End Set
    End Property
    Public Property [Date]() As DateTime
        Get
            Return Me.m_date
        End Get
        Set(value As DateTime)
            Me.m_date = value
            Me.OnPropertyChanged("Date")
        End Set
    End Property
    Public Sub OnPropertyChanged(propertyName As String)
        RaiseEvent PropertyChanged(Me, New PropertyChangedEventArgs(propertyName))
    End Sub
End Class
2. Now you can use this class to create three binding lists. Each one will contain data for the chart view. These methods are used in the previously described Drill event handler.
Load Data
private BindingList<DrillDownDataInfo> LoadDataByYears()
{
    Stream stream = System.Reflection.Assembly.GetAssembly(this.GetType()).GetManifestResourceStream("SamplesCS.ChartView.Features.DJIA.csv");
    BindingList<DrillDownDataInfo> chartData = new BindingList<DrillDownDataInfo>();
    using (StreamReader streamReader = new StreamReader(stream))
    {
        int yearsCount = 1;
        while (streamReader.Peek() != -1)
        {
            string[] data = streamReader.ReadLine().Split(',');
            DrillDownDataInfo dataItem = new DrillDownDataInfo(
                DateTime.Parse(data[0], CultureInfo.InvariantCulture),
                double.Parse(data[1], CultureInfo.InvariantCulture)
                );
            chartData.Add(dataItem);
            if (yearsCount++ > 10)
            {
                break;
            }
        }
    }
    return chartData;
}
internal BindingList<DrillDownDataInfo> ParseDataByMonth(int year)
{
    Stream stream = System.Reflection.Assembly.GetAssembly(this.GetType()).GetManifestResourceStream("SamplesCS.ChartView.Features.DJIAM.csv");
    BindingList<DrillDownDataInfo> chartData = new BindingList<DrillDownDataInfo>();
    using (StreamReader streamReader = new StreamReader(stream))
    {
        while (streamReader.Peek() != -1)
        {
            string line = streamReader.ReadLine();
            if (string.IsNullOrEmpty(line))
                continue;
            string[] data = line.Split(',');
            DateTime date = DateTime.Parse(data[0], CultureInfo.InvariantCulture);
            if (date.Year == year)
            {
                DrillDownDataInfo dataItem = new DrillDownDataInfo(
                    date,
                    double.Parse(data[1], CultureInfo.InvariantCulture)
                    );
                chartData.Add(dataItem);
            }
        }
    }
    return chartData;
}
internal BindingList<DrillDownDataInfo> ParseDataByDay(int year, int month)
{
    Stream stream = System.Reflection.Assembly.GetAssembly(this.GetType()).GetManifestResourceStream("SamplesCS.ChartView.Features.DJIAD.csv");
    BindingList<DrillDownDataInfo> chartData = new BindingList<DrillDownDataInfo>();
    using (StreamReader streamReader = new StreamReader(stream))
    {
        while (streamReader.Peek() != -1)
        {
            string line = streamReader.ReadLine();
            if (string.IsNullOrEmpty(line))
            {
                continue;
            }
            string[] data = line.Split(',');
            DateTime date = DateTime.Parse(data[0], CultureInfo.InvariantCulture);
            if (date.Year == year && date.Month == month && !string.IsNullOrEmpty(data[1]))
            {
                DrillDownDataInfo dataItem = new DrillDownDataInfo(
                    date,
                    double.Parse(data[1], CultureInfo.InvariantCulture)
                    );
                chartData.Add(dataItem);
            }
        }
        return chartData;
    }
}
Private Function LoadDataByYears() As BindingList(Of DrillDownDataInfo)
    Dim stream As Stream = System.Reflection.Assembly.GetAssembly(Me.[GetType]()).GetManifestResourceStream("SamplesCS.ChartView.Features.DJIA.csv")
    Dim chartData As New BindingList(Of DrillDownDataInfo)()
    Using streamReader As New StreamReader(stream)
        Dim yearsCount As Integer = 1
        While streamReader.Peek() <> -1
            Dim data As String() = streamReader.ReadLine().Split(","c)
            Dim dataItem As New DrillDownDataInfo(DateTime.Parse(data(0), CultureInfo.InvariantCulture), Double.Parse(data(1), CultureInfo.InvariantCulture))
            chartData.Add(dataItem)
            If System.Math.Max(System.Threading.Interlocked.Increment(yearsCount), yearsCount - 1) > 10 Then
                Exit While
            End If
        End While
    End Using
    Return chartData
End Function
Friend Function ParseDataByMonth(year As Integer) As BindingList(Of DrillDownDataInfo)
    Dim stream As Stream = System.Reflection.Assembly.GetAssembly(Me.[GetType]()).GetManifestResourceStream("SamplesCS.ChartView.Features.DJIAM.csv")
    Dim chartData As New BindingList(Of DrillDownDataInfo)()
    Using streamReader As New StreamReader(stream)
        While streamReader.Peek() <> -1
            Dim line As String = streamReader.ReadLine()
            If String.IsNullOrEmpty(line) Then
                Continue While
            End If
            Dim data As String() = line.Split(","c)
            Dim [date] As DateTime = DateTime.Parse(data(0), CultureInfo.InvariantCulture)
            If [date].Year = year Then
                Dim dataItem As New DrillDownDataInfo([date], Double.Parse(data(1), CultureInfo.InvariantCulture))
                chartData.Add(dataItem)
            End If
        End While
    End Using
    Return chartData
End Function
Friend Function ParseDataByDay(year As Integer, month As Integer) As BindingList(Of DrillDownDataInfo)
    Dim stream As Stream = System.Reflection.Assembly.GetAssembly(Me.[GetType]()).GetManifestResourceStream("SamplesCS.ChartView.Features.DJIAD.csv")
    Dim chartData As New BindingList(Of DrillDownDataInfo)()
    Using streamReader As New StreamReader(stream)
        While streamReader.Peek() <> -1
            Dim line As String = streamReader.ReadLine()
            If String.IsNullOrEmpty(line) Then
                Continue While
            End If
            Dim data As String() = line.Split(","c)
            Dim [date] As DateTime = DateTime.Parse(data(0), CultureInfo.InvariantCulture)
            If [date].Year = year AndAlso [date].Month = month AndAlso Not String.IsNullOrEmpty(data(1)) Then
                Dim dataItem As New DrillDownDataInfo([date], Double.Parse(data(1), CultureInfo.InvariantCulture))
                chartData.Add(dataItem)
            End If
        End While
        Return chartData
    End Using
End Function
Note that the data is loaded from external files. These files contain dates and values which are parsed and stored in out DrillDownDataInfo class objects. The files are included in Telerik UI for WinForms suite (navigate to Telerik\UI for WinForms Q3 2013\Examples\QuickStart\Resources ).
3. Finally you should initialize the chart by adding a series to it. Also the corresponding axes should be added.
Add Series
BarSeries barSeries = new BarSeries();
barSeries.ValueMember = "Value";
barSeries.CategoryMember = "Date";
barSeries.DataSource = LoadDataByYears();
this.radChartView1.View.Palette = KnownPalette.Metro;
DateTimeCategoricalAxis horizontalAxis = new DateTimeCategoricalAxis();
horizontalAxis.LabelFormat = "{0:yyyy}";
horizontalAxis.Title = "Year";
barSeries.HorizontalAxis = horizontalAxis;
LinearAxis verticalAxis = new LinearAxis();
verticalAxis.AxisType = AxisType.Second;
verticalAxis.Title = "USD";
barSeries.VerticalAxis = verticalAxis;
radChartView1.Series.Add(barSeries);
Dim barSeries As New BarSeries()
barSeries.ValueMember = "Value"
barSeries.CategoryMember = "Date"
barSeries.DataSource = LoadDataByYears()
Me.radChartView1.View.Palette = KnownPalette.Metro
Dim horizontalAxis As New DateTimeCategoricalAxis()
horizontalAxis.LabelFormat = "{0:yyyy}"
horizontalAxis.Title = "Year"
barSeries.HorizontalAxis = horizontalAxis
Dim verticalAxis As New LinearAxis()
verticalAxis.AxisType = AxisType.Second
verticalAxis.Title = "USD"
barSeries.VerticalAxis = verticalAxis
radChartView1.Series.Add(barSeries)
Now you can examine how this functionality works by clicking a data point in the chart. You can use the additional buttons to drill up or drill to top.