Tooltip
RadChartView provides a tooltip interactivity with the ChartTooltipController class and can be used to visualize arbitrary information related to a data point. If the user hovers directly over a data point, the tooltip will display information for this particular data point, otherwise it will display information for the closest data point to the hold location.In order to utilize this behavior users simply have to add it to the chart's Controllers collection. For example:
Add Controller
radChartView1.Controllers.Add(new ChartTooltipController());
radChartView1.Controllers.Add(New ChartTooltipController())
The ChartTooltipController will be added automatically if the ShowToolTip property of RadChartView control is set to true:
Set Property
radChartView1.ShowToolTip = true;
radChartView1.ShowToolTip = True
A sample is shown below:
Sample Setup
radChartView1.AreaType = ChartAreaType.Cartesian;
BarSeries barSeries1 = new BarSeries();
barSeries1.DataPoints.Add(new CategoricalDataPoint(10, "1"));
barSeries1.DataPoints.Add(new CategoricalDataPoint(4, "2"));
barSeries1.DataPoints.Add(new CategoricalDataPoint(23, "3"));
barSeries1.DataPoints.Add(new CategoricalDataPoint(11, "4"));
barSeries1.DataPoints.Add(new CategoricalDataPoint(15, "5"));
barSeries1.DataPoints.Add(new CategoricalDataPoint(10, "6"));
barSeries1.DataPoints.Add(new CategoricalDataPoint(4, "7"));
barSeries1.DataPoints.Add(new CategoricalDataPoint(7, "8"));
barSeries1.DataPoints.Add(new CategoricalDataPoint(11, "9"));
barSeries1.DataPoints.Add(new CategoricalDataPoint(15, "10"));
radChartView1.Series.Add(barSeries1);
BarSeries barSeries2 = new BarSeries();
barSeries2.DataPoints.Add(new CategoricalDataPoint(6, "1"));
barSeries2.DataPoints.Add(new CategoricalDataPoint(20, "2"));
barSeries2.DataPoints.Add(new CategoricalDataPoint(7, "3"));
barSeries2.DataPoints.Add(new CategoricalDataPoint(8, "4"));
barSeries2.DataPoints.Add(new CategoricalDataPoint(4, "5"));
barSeries2.DataPoints.Add(new CategoricalDataPoint(10, "6"));
barSeries2.DataPoints.Add(new CategoricalDataPoint(24, "7"));
barSeries2.DataPoints.Add(new CategoricalDataPoint(17, "8"));
barSeries2.DataPoints.Add(new CategoricalDataPoint(18, "9"));
barSeries2.DataPoints.Add(new CategoricalDataPoint(43, "10"));
radChartView1.Series.Add(barSeries2);
radChartView1.ShowToolTip = true;
radChartView1.AreaType = ChartAreaType.Cartesian
Dim barSeries1 As New BarSeries
barSeries1.DataPoints.Add(New CategoricalDataPoint(10, "1"))
barSeries1.DataPoints.Add(New CategoricalDataPoint(4, "2"))
barSeries1.DataPoints.Add(New CategoricalDataPoint(23, "3"))
barSeries1.DataPoints.Add(New CategoricalDataPoint(11, "4"))
barSeries1.DataPoints.Add(New CategoricalDataPoint(15, "5"))
barSeries1.DataPoints.Add(New CategoricalDataPoint(10, "6"))
barSeries1.DataPoints.Add(New CategoricalDataPoint(4, "7"))
barSeries1.DataPoints.Add(New CategoricalDataPoint(7, "8"))
barSeries1.DataPoints.Add(New CategoricalDataPoint(11, "9"))
barSeries1.DataPoints.Add(New CategoricalDataPoint(15, "10"))
radChartView1.Series.Add(barSeries1)
Dim barSeries2 As New BarSeries()
barSeries2.DataPoints.Add(New CategoricalDataPoint(6, "1"))
barSeries2.DataPoints.Add(New CategoricalDataPoint(20, "2"))
barSeries2.DataPoints.Add(New CategoricalDataPoint(7, "3"))
barSeries2.DataPoints.Add(New CategoricalDataPoint(8, "4"))
barSeries2.DataPoints.Add(New CategoricalDataPoint(4, "5"))
barSeries2.DataPoints.Add(New CategoricalDataPoint(10, "6"))
barSeries2.DataPoints.Add(New CategoricalDataPoint(24, "7"))
barSeries2.DataPoints.Add(New CategoricalDataPoint(17, "8"))
barSeries2.DataPoints.Add(New CategoricalDataPoint(18, "9"))
barSeries2.DataPoints.Add(New CategoricalDataPoint(43, "10"))
radChartView1.Series.Add(barSeries2)
radChartView1.ShowToolTip = True
Figure 1: ToolTip
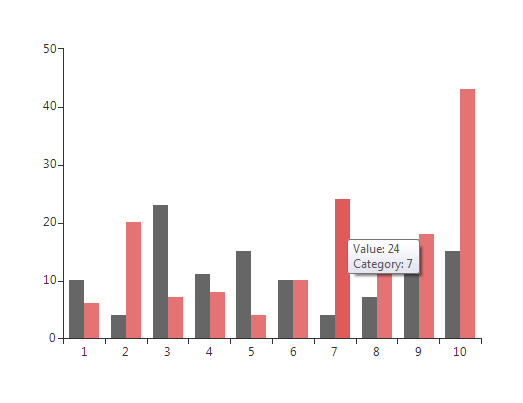
The ChartTooltipController also exposes a tooltip event. The event handler is a suitable place for changing the precalculated text.
Subscribe to Event
ChartTooltipController tooltipController = new ChartTooltipController();
tooltipController.DataPointTooltipTextNeeded += tooltipController_DataPointTooltipTextNeeded;
this.radChartView1.Controllers.Add(tooltipController);
Dim tooltipController As New ChartTooltipController()
AddHandler tooltipController.DataPointTooltipTextNeeded, AddressOf tooltipController_DataPointTooltipTextNeeded
Me.RadChartView1.Controllers.Add(tooltipController)
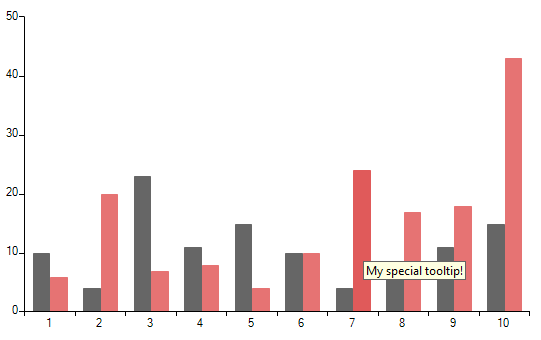
Change ToolTip`s Text
private void tooltipController_DataPointTooltipTextNeeded(object sender, DataPointTooltipTextNeededEventArgs e)
{
    e.Text = "My special tooltip!";
}
Private Sub TooltipController_DataPointTooltipTextNeeded(sender As Object, e As DataPointTooltipTextNeededEventArgs)
    e.Text = "My special tooltip!"
End Sub
Figure 2: Modified ToolTip