Scroll and Zoom
RadChartView provides zoom and scroll interactivity with the ChartPanZoomController class. It is very simple to use and allows users to zoom in the chart plot area when are there is a dense area of data points that can not be seen clearly at the normal chart scale. The scroll functionality allows moving the visible area of the chart. In order to utilize this behavior users simply have to add it to the chart's Controllers collection and specify the zoom mode. For example:
ChartPanZoomController Setup
ChartPanZoomController panZoomController = new ChartPanZoomController();
panZoomController.PanZoomMode = ChartPanZoomMode.Horizontal;
radChartView1.Controllers.Add(panZoomController);
Dim panZoomController As New ChartPanZoomController()
panZoomController.PanZoomMode = ChartPanZoomMode.Horizontal
RadChartView1.Controllers.Add(panZoomController)
When adding a new ChartPanZoomController all other pan and zoom controllers are removed if such exists.
The ChartPanAndZoomController will be added automatically if the ShowPanZoom property of RadChartView control is set to true. In this case the PanZoomMode is Horizontal (by default):
Add Using the Property
radChartView1.ShowPanZoom = true;
RadChartView1.ShowPanZoom = True
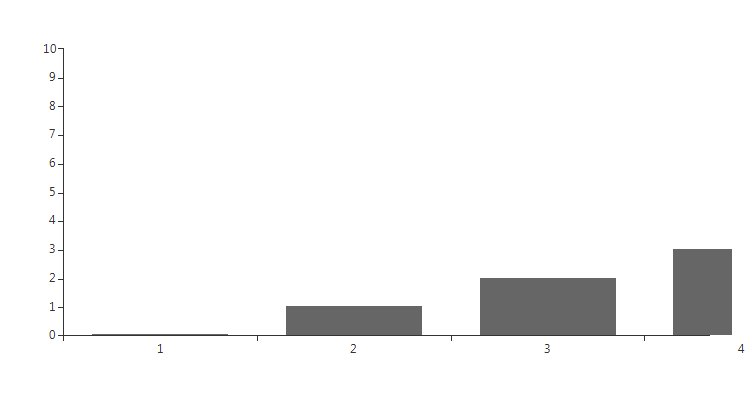
The PanZoomMode property allow developers to restrict zooming. Setting either of these properties to the Both value removes any restrictions and the chart can be zoomed in both the horizontal and vertical axes. The last two values are Horizontal and Vertical which restrict the behavior horizontally and vertically respectively. You can now get/set the zoom and pan values of the RadChartView using the Zoom and Pan methods. Note that the offset should be provided in negative absolute values e.g Pan(-300,0) will offset the chart horizontally at 300px. You may use it to simultaneously set zoom for the both axes by separating the values with comma. For example a Zoom(3 , 1) setting specifies that the data will be zoomed 3 times according to the XAxis and won't be zoomed by YAxis.
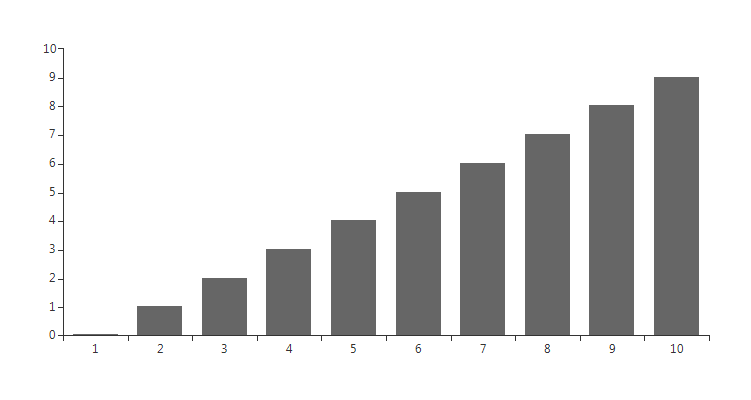
Figure 1: Initial Chart

Zooming
radChartView1.Zoom(3, 1);
RadChartView1.Zoom(3, 1)
Figure 2: Zooming

Panning
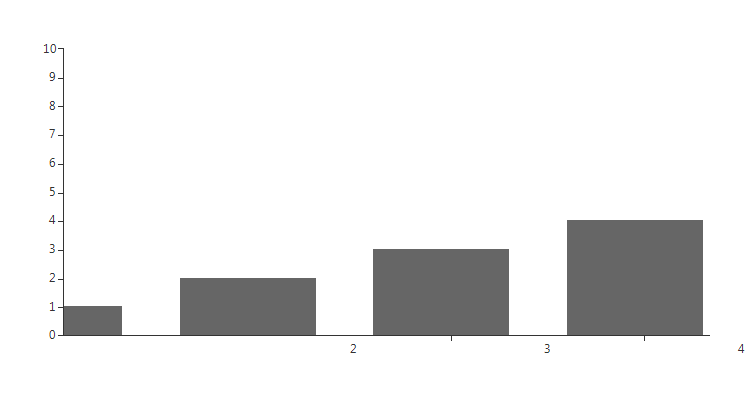
Panning with 300 pixels:
radChartView1.Pan(-300, 0);
RadChartView1.Pan(-300, 0)
Figure 3: Panning

The zoom factor can be controlled using Ctrl+MouseWheel for zoom in and zoom out functionality. Left Button MouseDown+Move for pan/scroll functionality.
The currently applied Zoom and Pan factors can be obtained from the IChartView object.
Current Zoom and Pan
IChartView view = this.radChartView1.ChartElement.View;
double zoomX = view.ZoomWidth;
double zoomY = view.ZoomHeight;
double panX = view.PlotOriginX;
double panY = view.PlotOriginY;
Dim view As IChartView = Me.RadChartView1.ChartElement.View
Dim zoomX = view.ZoomWidth
Dim zoomY = view.ZoomHeight
Dim panX = view.PlotOriginX
Dim panY = view.PlotOriginY