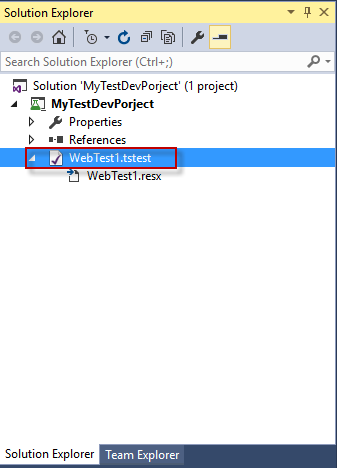
By default the newly created project contains a Web test.
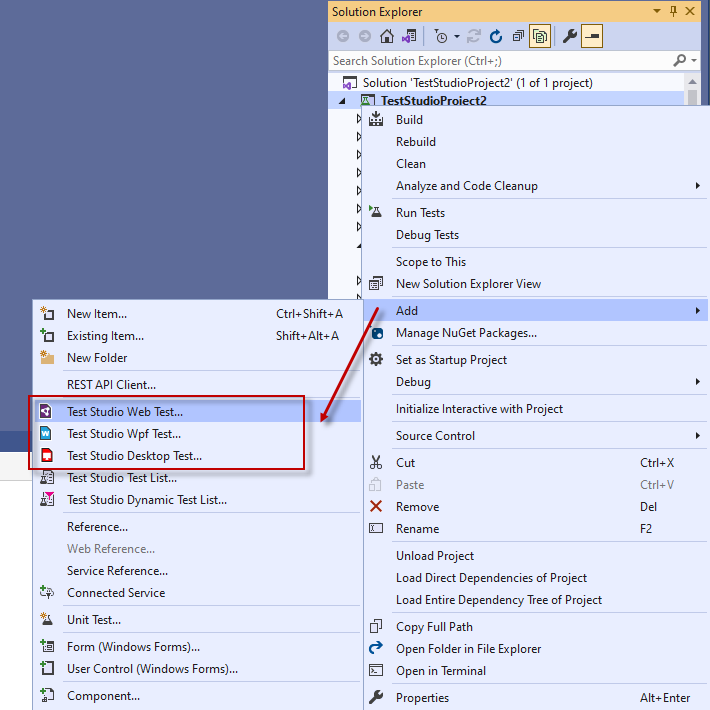
To add new test in the project click with the right mouse button on the project name in Solution Explorer, select Add and choose between Test Studio Web Test... or Test Studio WPF Test....
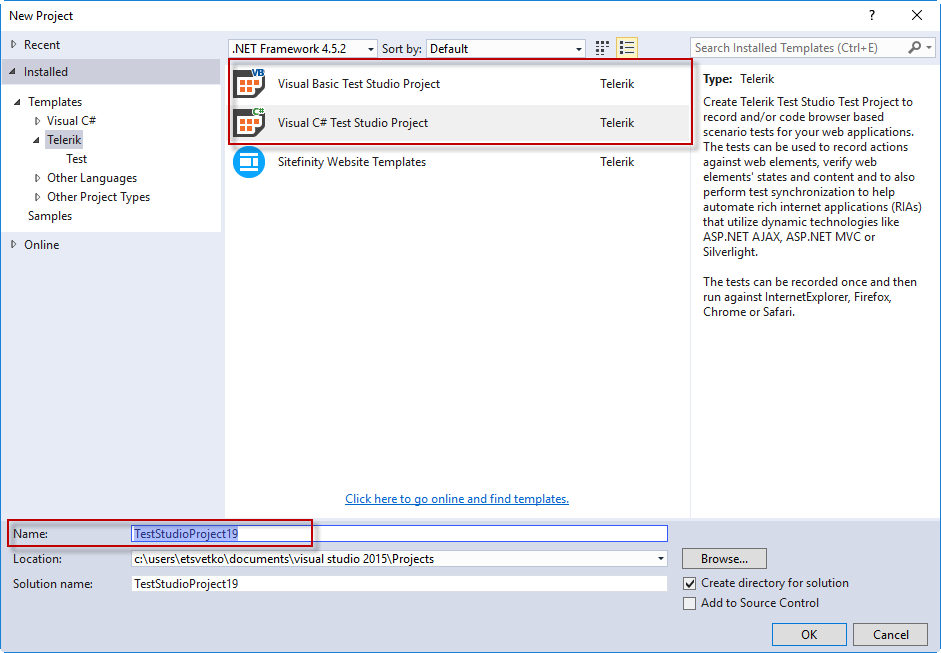
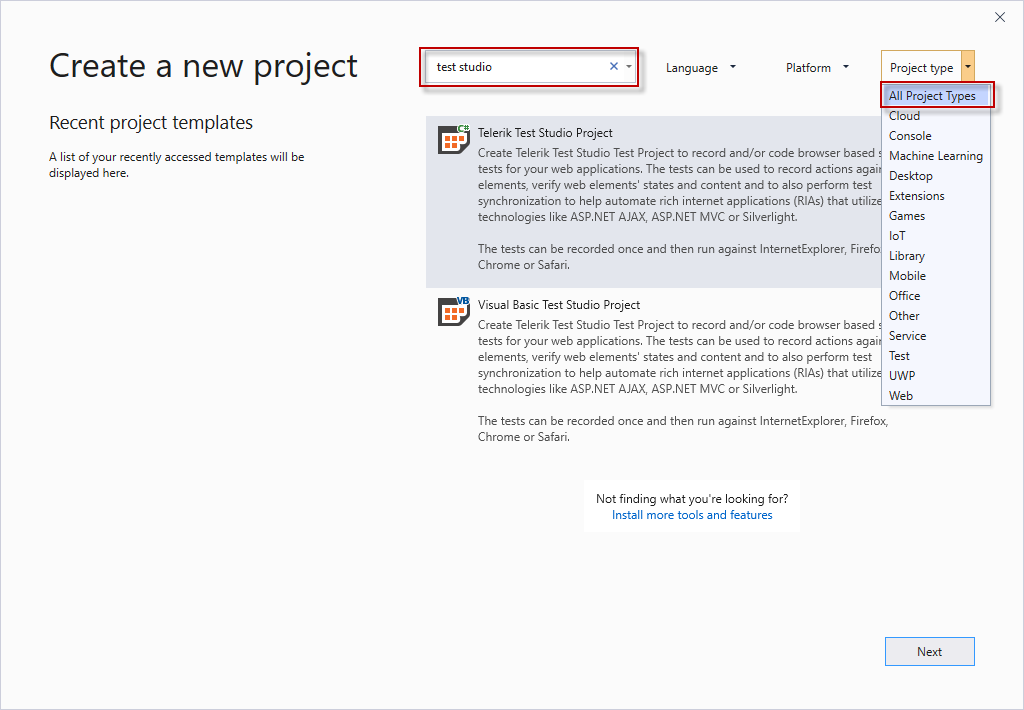
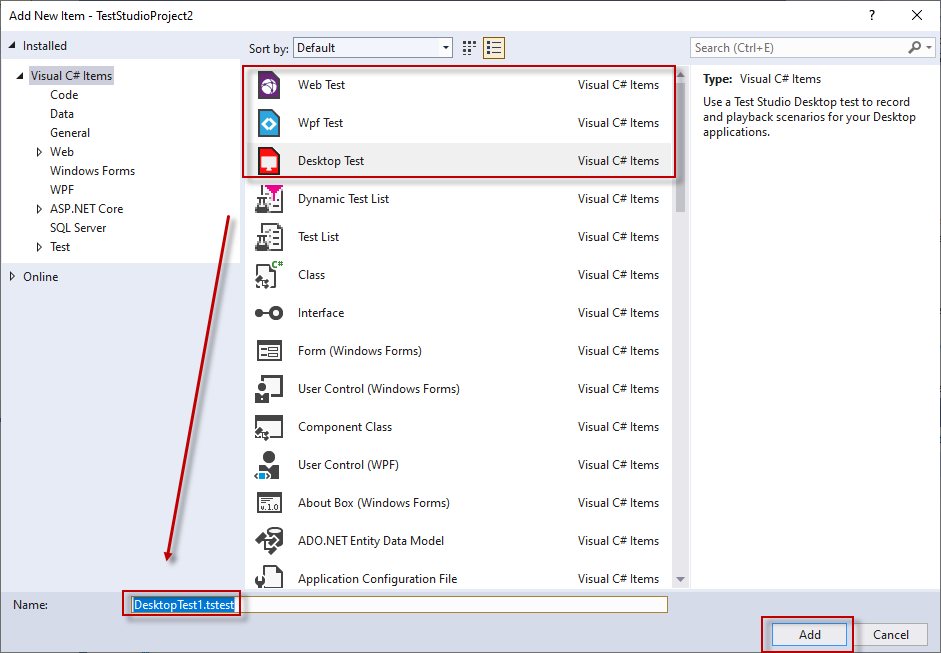
The respective item is selected in the list of items, type a name and click Add.
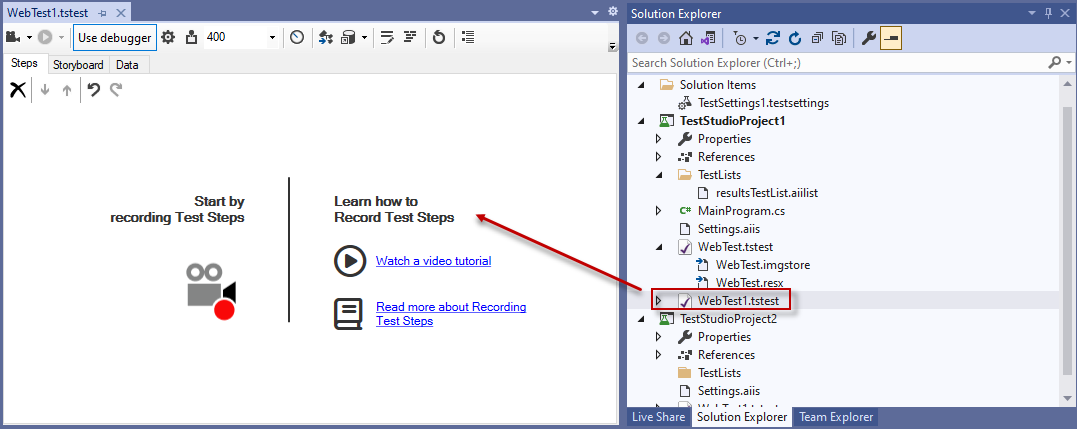
To open the test double click on its name in the Solution Explorer.
Note! The supported for recording browsers are Internet Explorer, Chrome, FireFox and Edge Chromium.
Double click a test from the Solution Explorer to open it. Click on any of the Record buttons to launch a new browser or an instance of the WPF application to record against.
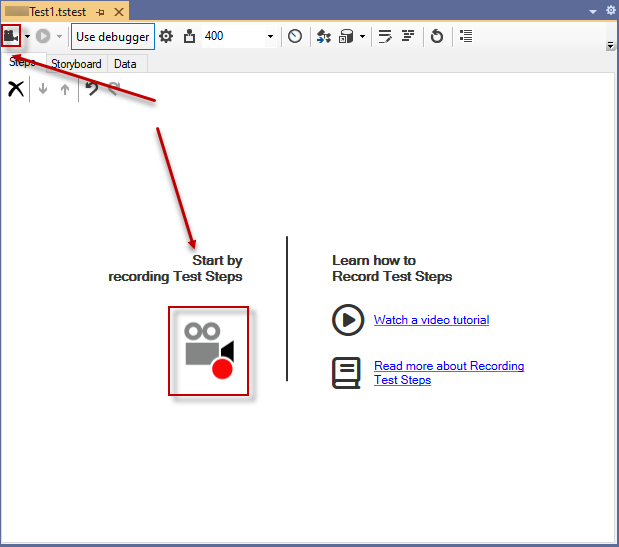
Once the browser/application is launched the Test Studio Dev recorder toolbar gets attached to the that instance and records steps in the test for each action against the application under test.
See also:
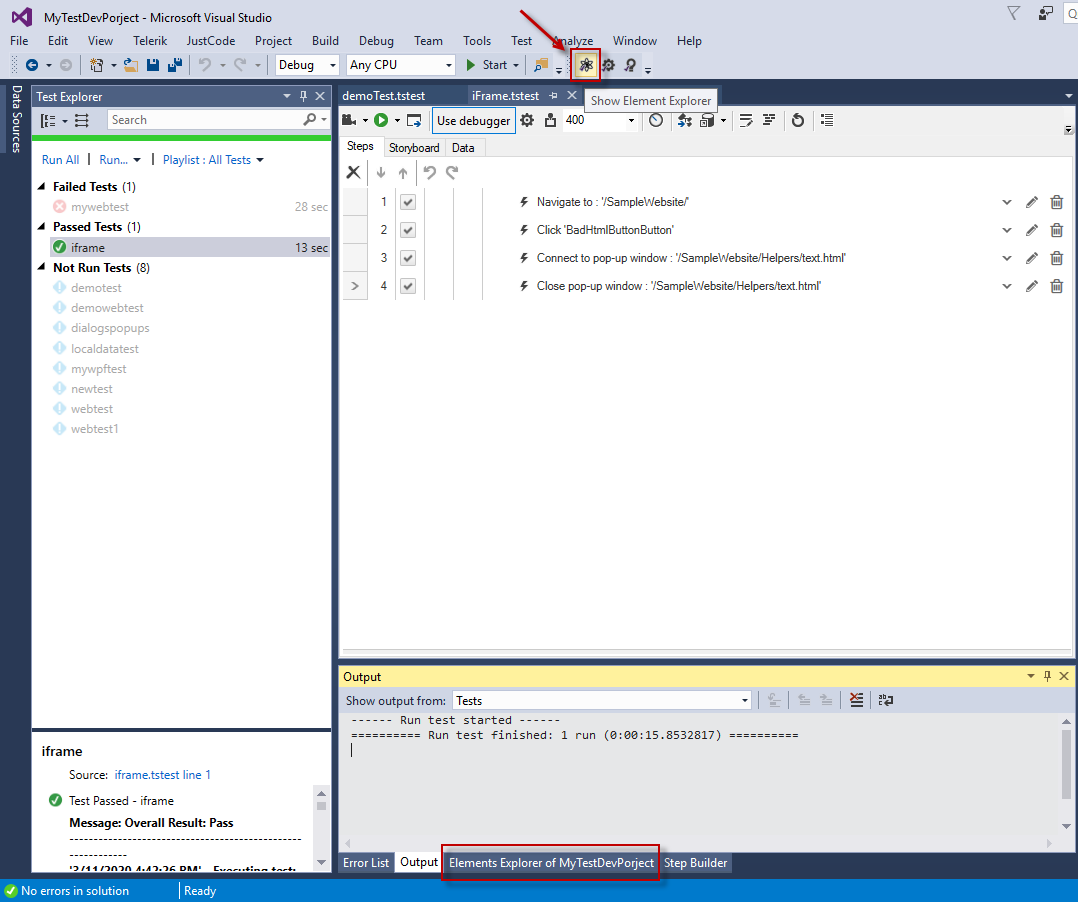
The Elements Explorer displays all elements included in the test during recording the test. It is similar to the DOM Explorer in that it displays a tree of elements, but the Elements Explorer only contains elements you want to use in your tests. Also, the elements in the tree view have properties that are more specific to testing.
To open the Elements Explorer in project click on the Show Elements Explorer button. It will appear in the lower middle pane next to Error List and Output tabs.
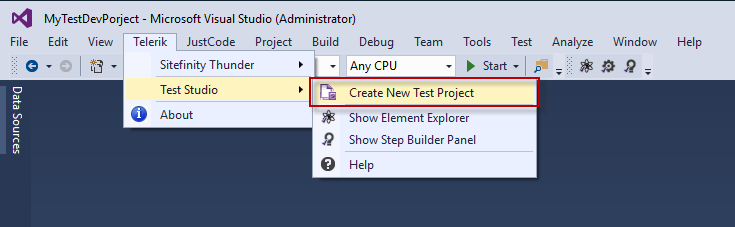
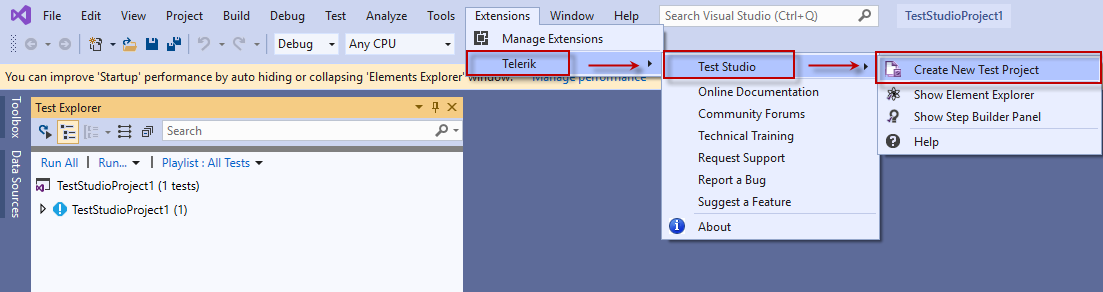
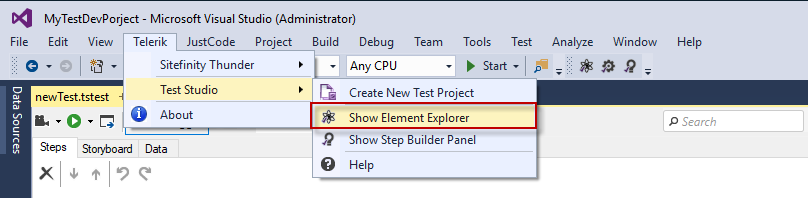
The Elements Explorer can be also shown on screen from the Telerik menu.
Note! The supported browsers for execution are Internet Explorer, Chrome, FireFox, Microsoft Edge, Safari.
Test Studio Dev tests could be executed from the VS Test Explorer or with the Test Studio Dev Test Runner.
To execute the currently opened test click on the Execute Test button to select a browser to run the test against.
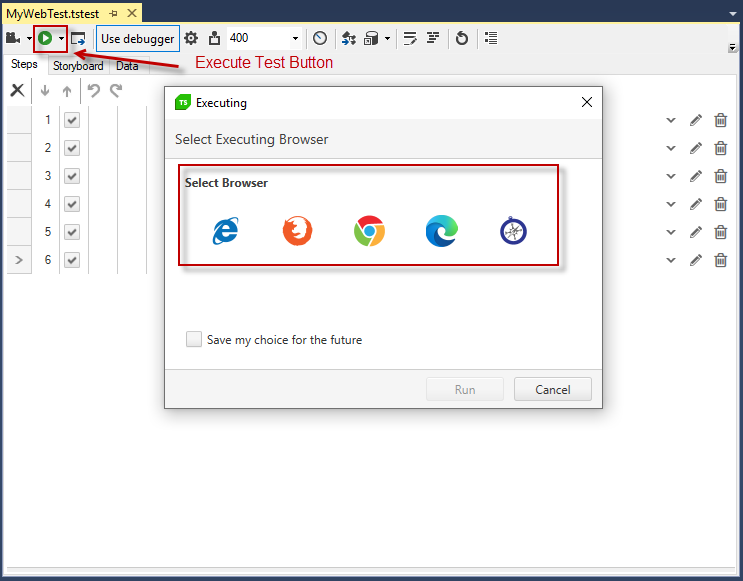
An instance of the selected browser will start and all recorded actions in test will be executed.
Read more details for the settings which could be applied for the test run.
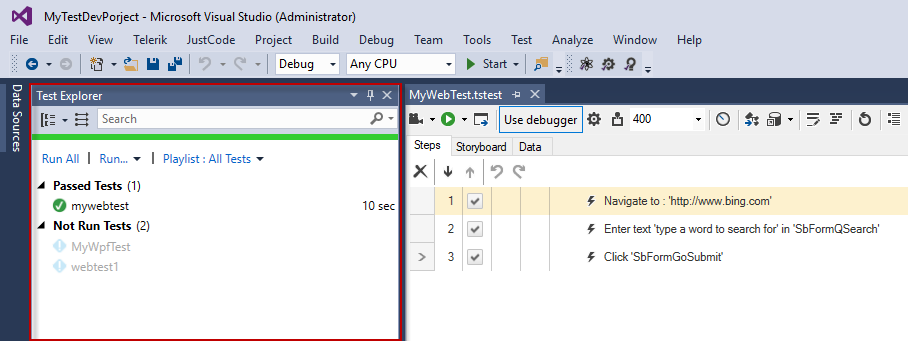
The Test Explorer in Visual Studio automatically lists and provides all Test Studio Dev tests for execution.
Ensure the project is re-built before initiating a run from the VS Test Explorer. Any recent changes will not be reflected otherwise.
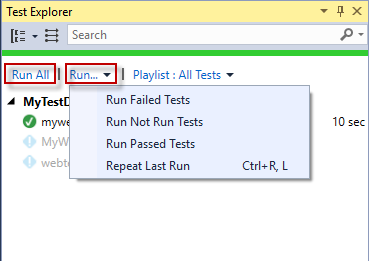
Run the tests with the Run All button. Or choose a group of tests to run from the dropdown options of the Run... button in Test Explorer.
An instance of the selected browser will start and all recorded actions in test will be executed.
Find further details for the Test Explorer execution.
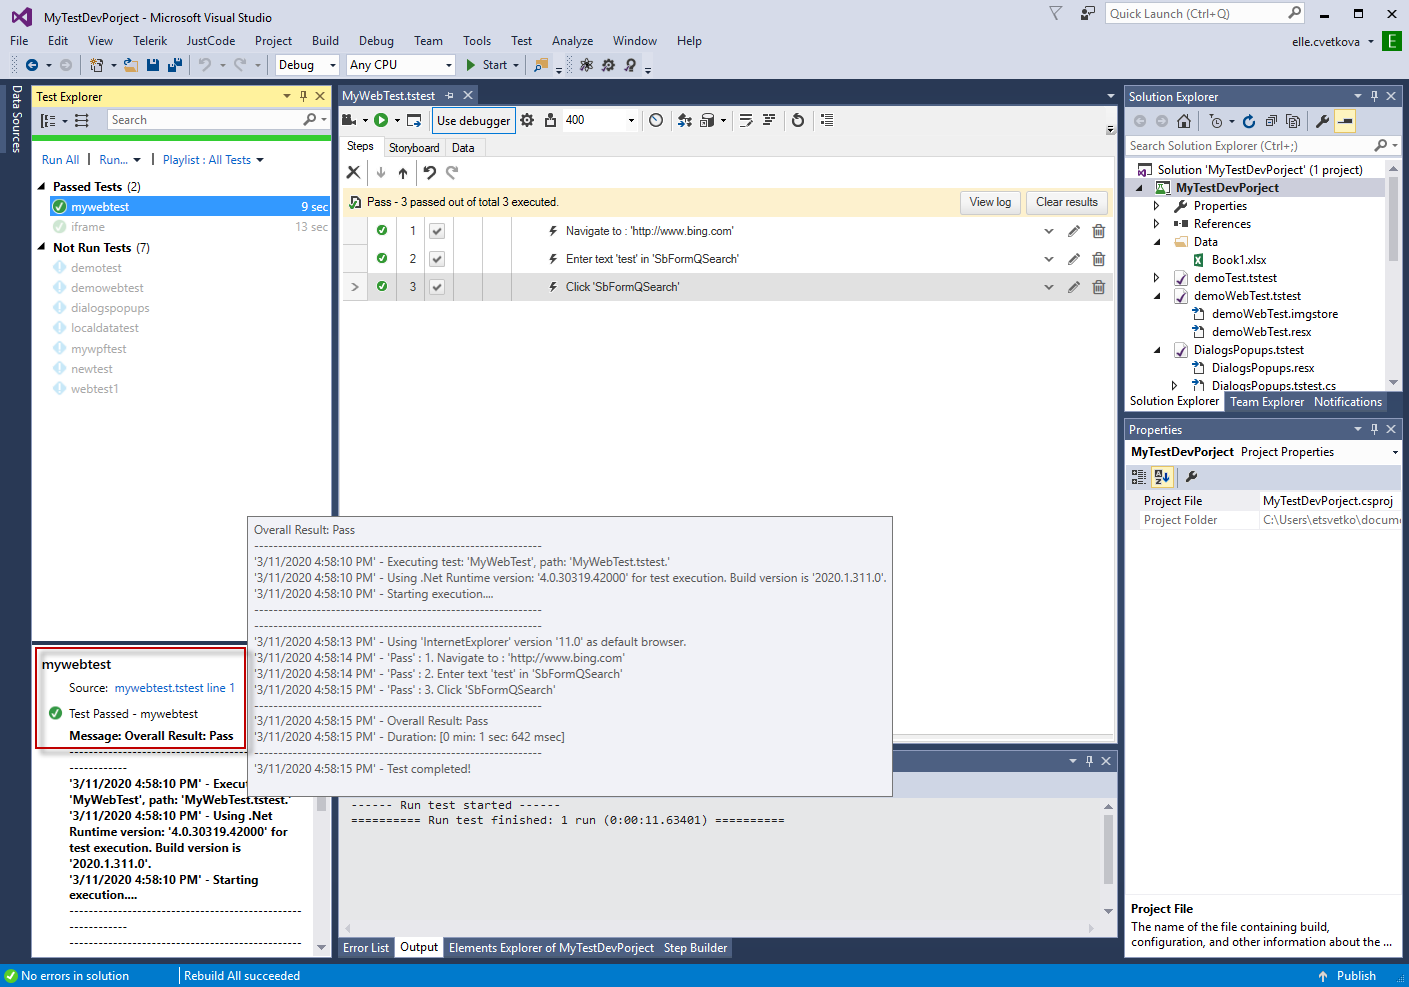
Each test run generates test results.
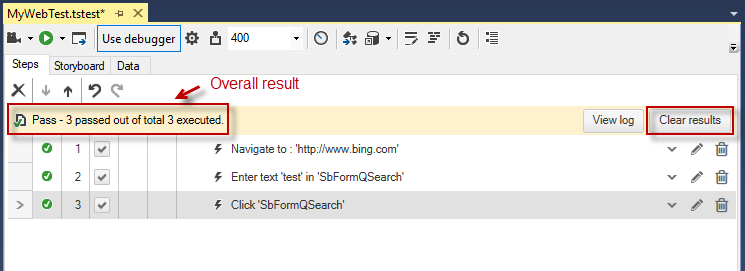
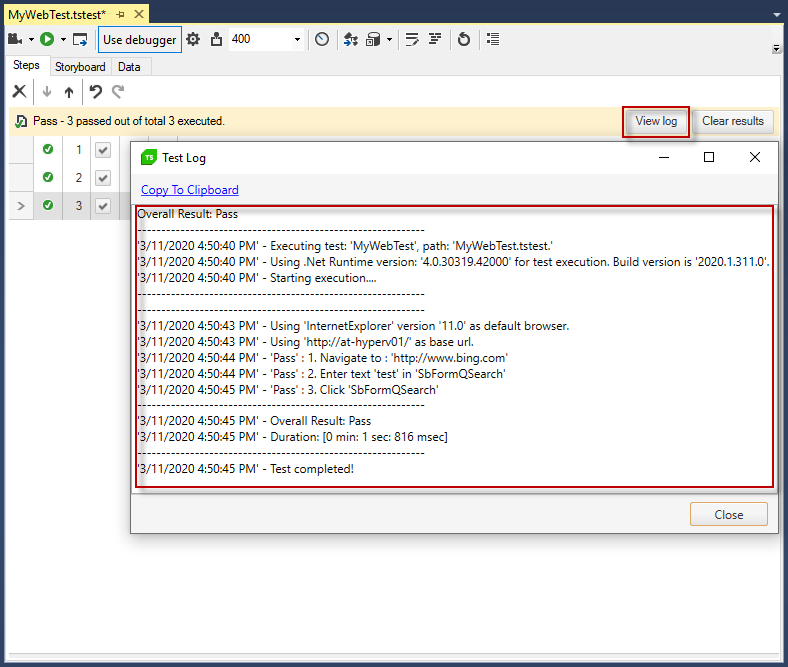
Test Studio Dev Quick Execution displays the outcome of the executed test in overall and writes verbose results info in an Execution log. The test results are available for review as long as the test stays opened in the solution or until the Clear results button is clicked.
The Execution log provides details for the executed steps in the test.
VS Test Explorer displays the results of test execution under the list of test in Test Explorer pane. These are in the same format as the results generated by Test Studio Dev execution. The test results are available until the project/solution stays opened.
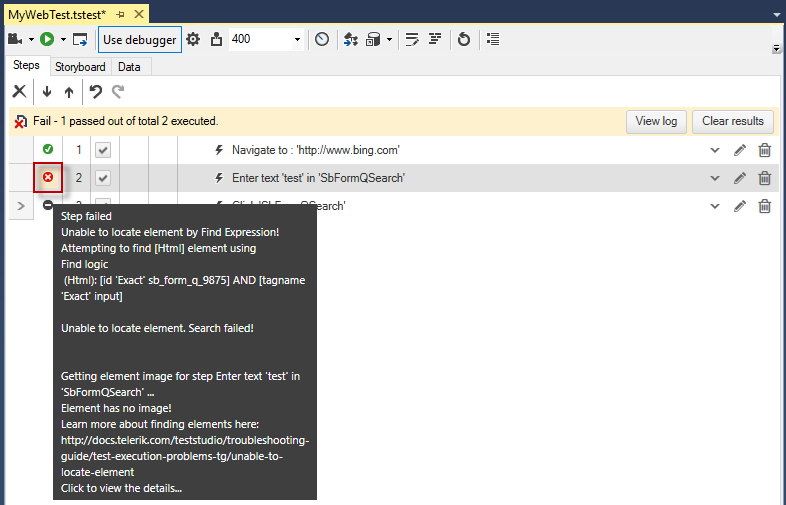
The test execution will be terminated in case a step fails and the test will be marked as Failed.
Test Studio Dev displays status for each step in the test - Passed, Failed, Not Run. Hovering over the red crossed circle in front the failed step will show a tooltip with details about the failure.
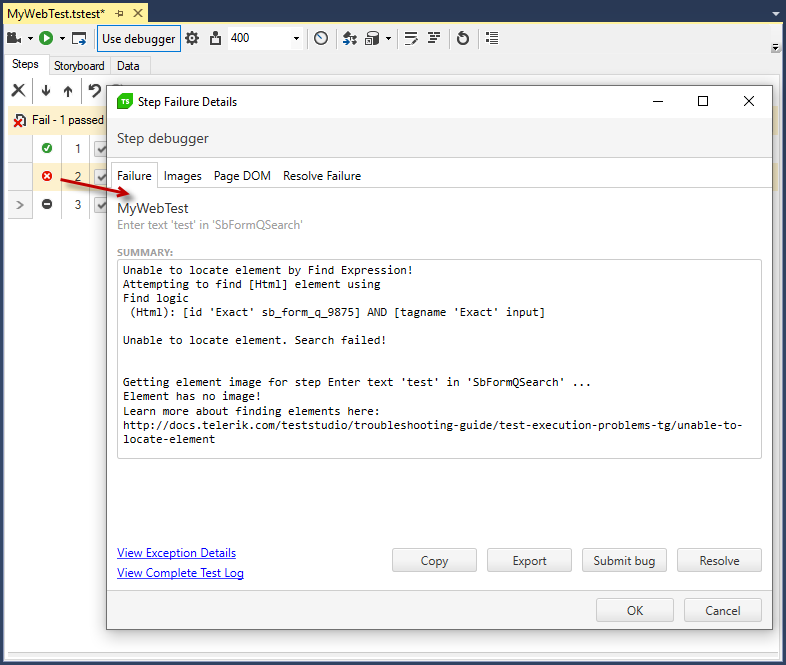
Click on the red crossed circle opens the Step Failure Details dialog. It provides detailed description of the failure reason and additional debugging options.
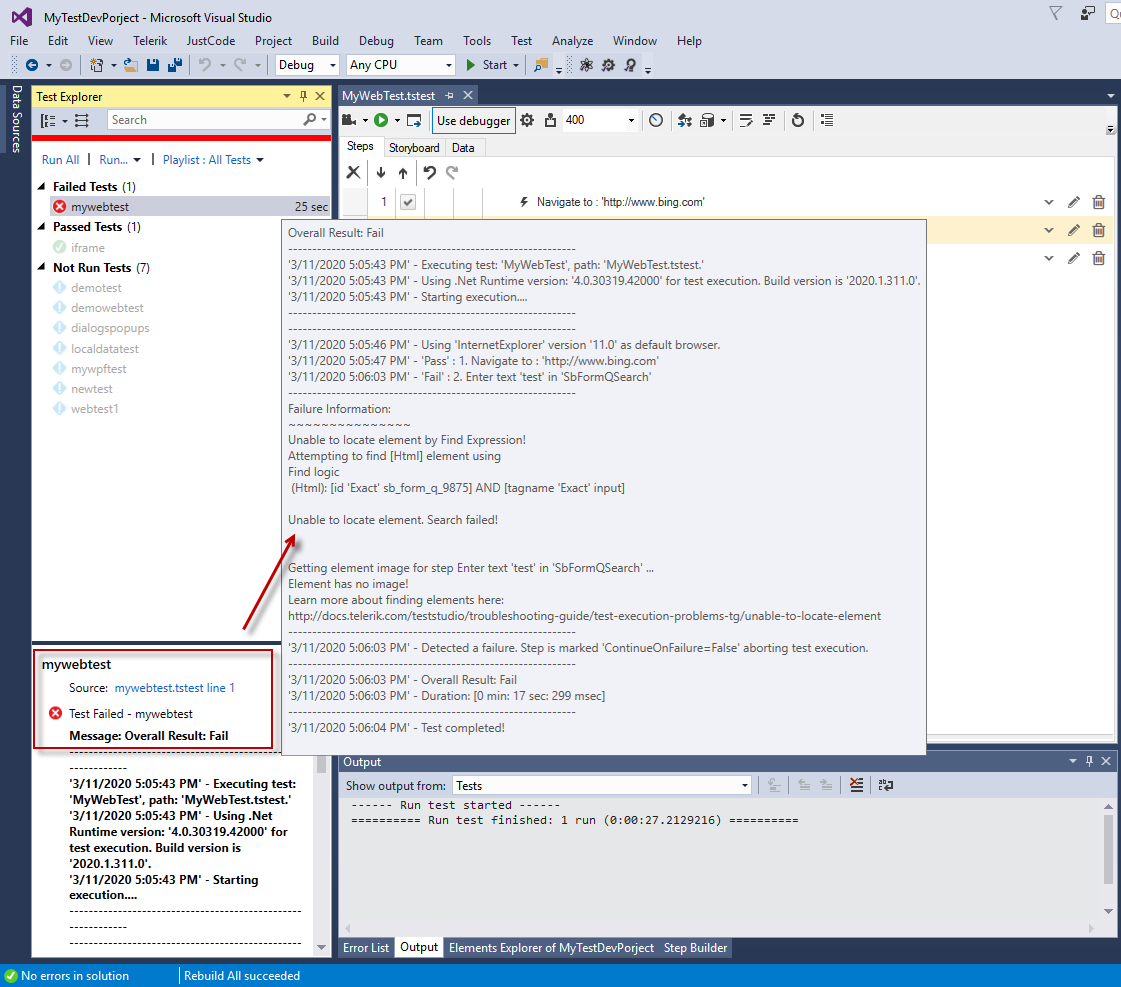
VS Test Explorer displays the test as well as Failed. The test result is under the listed tests and displays the common information for the failure as it is listed in the Execution log.
Test Studio Dev Edition allows you to implement coded solutions for scenarios that require more complexity than what can be composed with recording your actions or building advanced steps with the Step Builder. You can create new or convert existing steps to coded ones, define your custom logic in code behind files or any custom library that your projects links to. For more detailed information read the following article.