Quick Execution
Quick execution allows you to easily find out if a test is configured and designed for stable future execution. It provides many options to support you in debugging a failed test. How these could be helpful is described below in this article.
While a test is being executed do not start another instance of the same browser until the run is finished!
Execute a Test
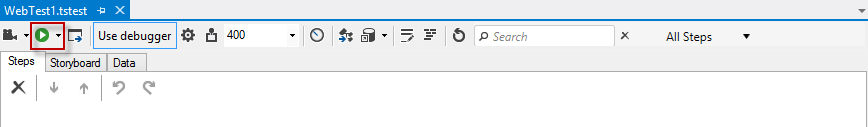
1. Once a test scenario is already recorded, click the Execute button in the test step pane.
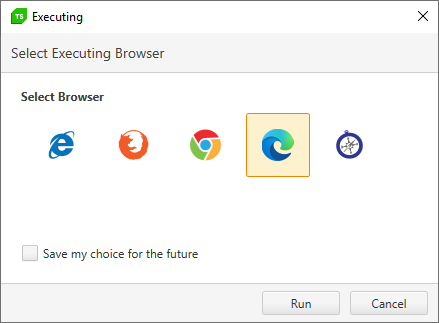
1.1 Select the execution browser. This step will be skipped if you have already set a preferred browser from the Project Settings Browsers tab.
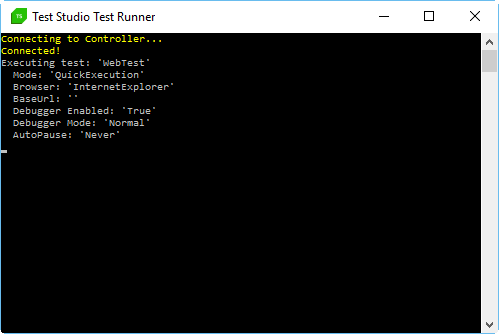
2. The Test Studio Dev Test Runner launches first in a command prompt window. This calls the set browser or application.
Visual Debugger
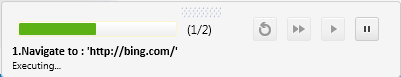
By default in the lower right of your screen there is a ribbon which indicates the current step, includes play and pause ability, and shows additional Debug Options if you set a Breakpoint to any step. This is the visual debugger and is a feature you could turn on or off.
Execute with Annotation
Click Toggle Annotation button to have the browser annotate each step with a brief message and by highlighting the target element for each step. Note that this will slow the test run down by inserting a delay between steps (in milliseconds) you set either from the dropdown menu or by entering a custom value.

Debugger Options
Click Debugger Options icon to to turn the debugger on/off and customize the Auto-Pause Options, if errors occur during the execution.

Execution Timeouts
Quick access to change the default timeouts for Wait on elements and Client ready is also available through the test step pane.

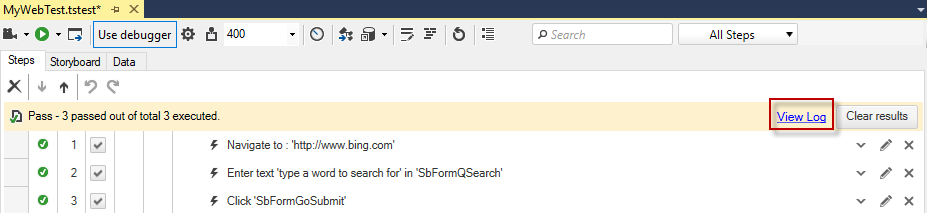
Execution Results
Afterwards, when the test execution is complete, test results are automatically generated and can be reviewed. Click View Log for test results details.