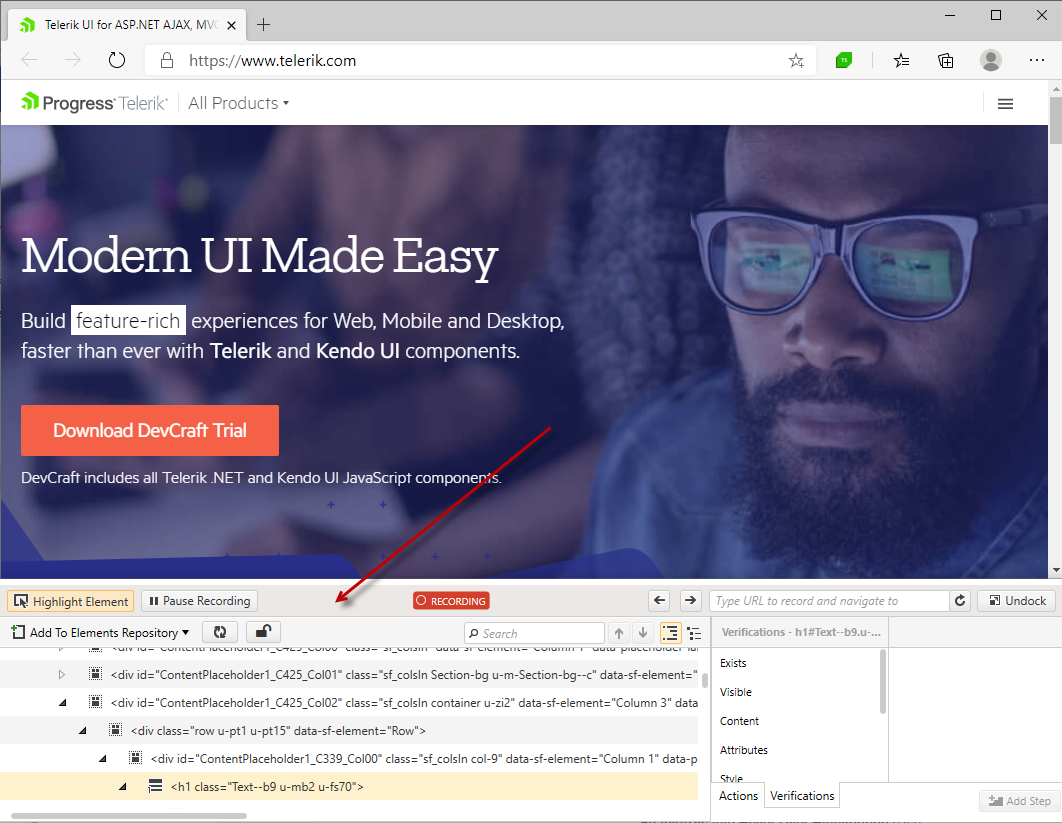
Recording Toolbar
The recording toolbar gets attached to the selected browser for recording once it launches the provided valid URL. By default the toolbar is docked to the browser instance.
After entering a URL and pressing Enter/Start Recording button the recording toolbar is attached at the bottom of the browser:

It provides different functionalities to ease the recording process.
DOM Explorer Options
Below are listed its features related to the DOM explorer and how you could use these during recording:
 |
Enable/Disable Hover Over Highlighting (Use "Pause/Break" on your keyboard to toggle the highlighting on/off) |
 |
Pause Recording (Use "Print Screen" on your keyboard to pause recording) |
 |
Start Recording (Use "Print Screen" on your keyboard to resume recording) |
 |
Reconnect Recorder - restores communication between Test Studio and the recording browser window or WPF app, if necessary |
 |
Navigation panel - during the recording session type URL to navigate to or refresh the browser |
 / / 
|
Undock/Dock - undock or dock back the recorder |
 |
Add To Elements Repository - add a single or multiple elements to the Elements Explorer) |
 |
Manual Refresh of the DOM - Used when auto-refresh is paused and the DOM tree is changed |
 / / 
|
Freeze/Unfreeze DOM tree - Pause/Resume the DOM tree auto-refresh option |
 |
Elements Tree/Tag View - whether to display the elements as tree view or tag view |