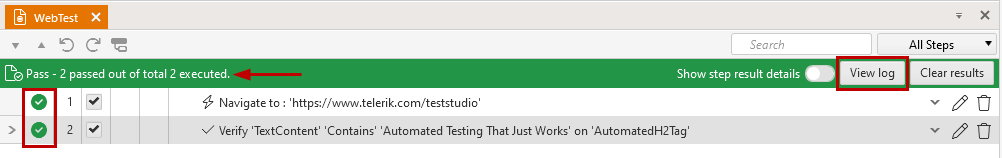
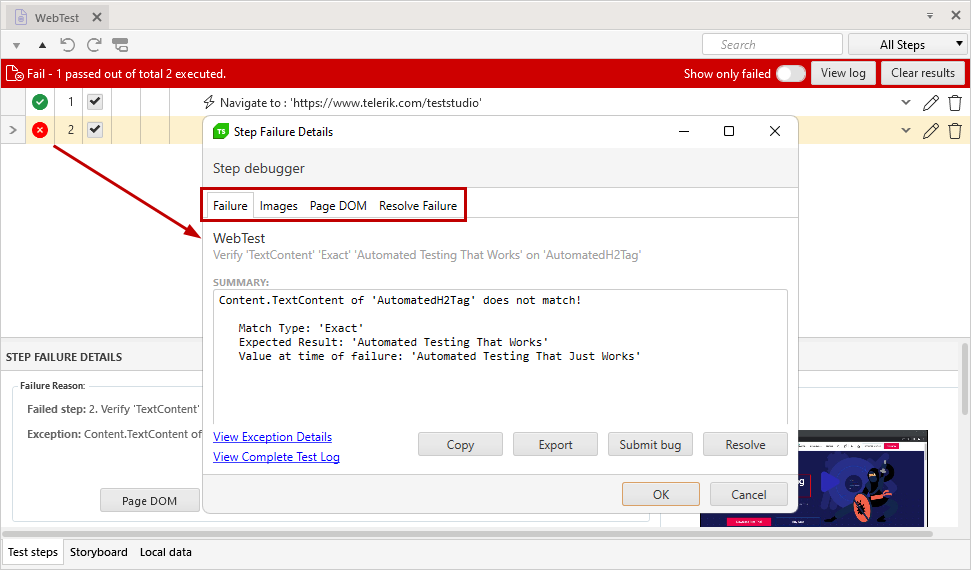
Each failed step provides additional details for the failure, if you hover over the red circle in front of it. By clicking on that red crossed circle, you open the Step Failure Details dialog. You can see detailed message for the failure, screenshots for the expected image and image at the time of failure, the DOM tree at the time of failure and suggestion how to solve the error.
The Visual debugger has different options for debugging a test during a quick test run. It is often used when the test does not behave as expected, and especially when it is not clear at which action the issue occurs.
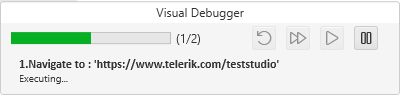
The default quick run will trigger the Visual Debugger in the lower right corner of your display. It indicates the current step, includes play and pause ability, and shows additional Debug Options if you set the Debugger options to pause on errors.
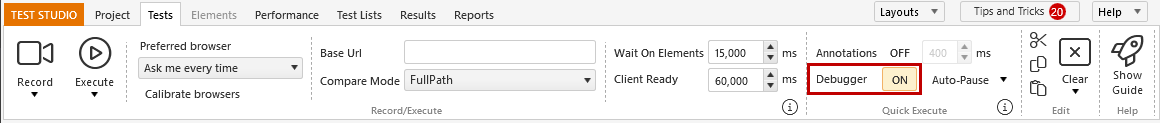
Click Debugging Options icon in the Test ribbon to turn the debugger on/off and customize the Auto-Pause Options, if errors occur during the quick execution.
You can also set a Breakpoint to any step where you need to pause the test execution and use the Debugger.
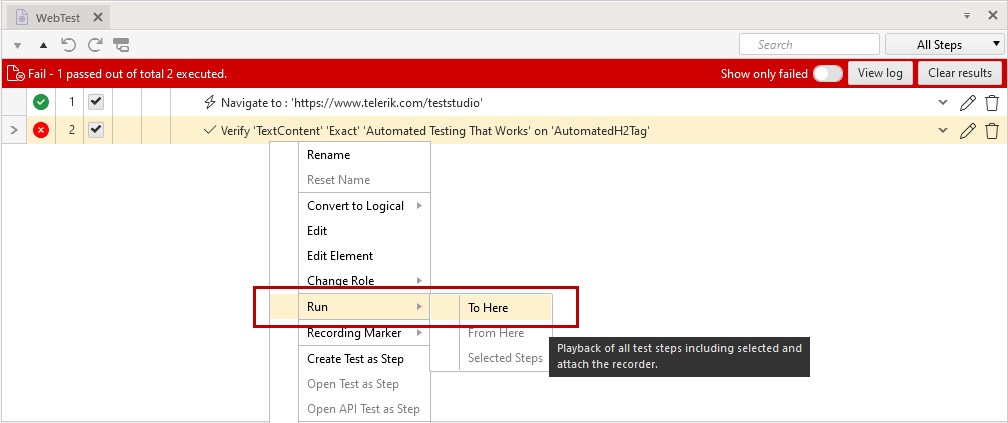
A useful approach to examine a failing test is to execute it partially to a step (or few steps) before the failing one. Test Studio allows you to execute a test partially with the Run... options from the Step Context Menu.
-
To Here - launches a new instance of the selected browser, execute the preceding (including the selected) test step(s), and finishes the run with recorder attached to the browser.
-
From Here - execute the subsequent steps in an existing browser instance (must have recording toolbar attached to browser).
-
Selected Steps - execute the selected step(s) in an existing browser instance (must have recording toolbar attached to browser).
There are occasions when a test is reported passed, but the actions, which it is expected to perform do not actually happen. In such cases it can be helpful to enable the annotations during the quick test run. Click the Toggle Annotation button to have the browser annotate each step with a brief message and by highlighting that step's target element.
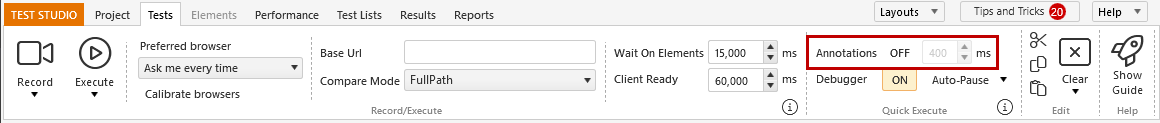
This will also slow down the test run by the configured amount (in milliseconds) between each step. You can set it either from the menu or by entering a custom value.
Tip
Check here how you can use the annotations for troubleshooting a failing test.
The application log is a list of messages logged by Test Studio throughout the tool usage and bring information for the performed actions in Test Studio. It is usually used, if there are unexpected errors, crashes, or a recommended configuration in the project, which cannot be successfully accomplished.
The Results tab displays results for all locally and remotely executed test lists. There you can analyze the executions, drill down to the individual test step and go back up to the main test list level for each execution.