Machines Status View
The Execution Status View is a useful source of information for the current status of a Scheduling setup. You can find out if a project is connected to a configured Scheduling service, or it is set to run only locally. For projects, which are connected to a Scheduling service, you can find additional details for the Test Studio services state and the currently registered Execution machines.
- Open Machines Status View Window
- Connect Project Locally
- Connect Project Remotely
- Connect Project via Proxy Server
Machines Status View Window
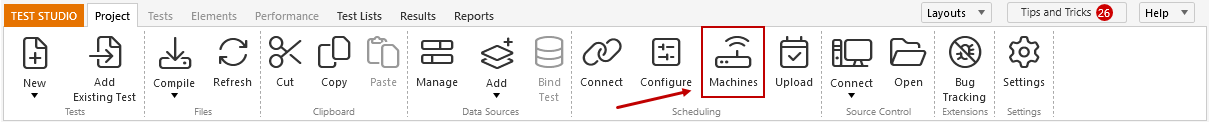
To access the Status view you can click Machines in the Scheduling ribbon of the Project tab.
Connect Project Locally
When current project is connected to schedule test lists locally, the Machines Status view provides details only for the local service status under the Scheduling server section.
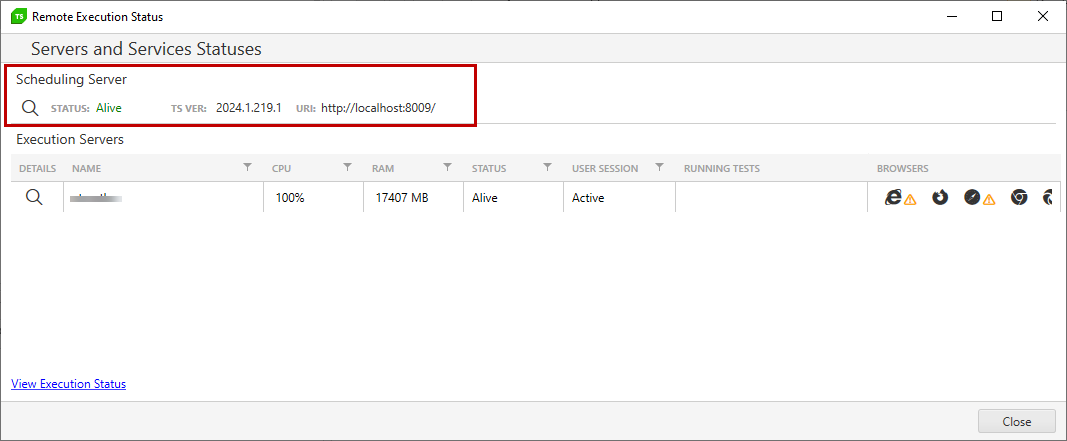
The local Test Runner running in the system tray is listed under the Execution Servers section. Use the Magnifier icon or double click the machine name to open the view with additional details for the execution client - available browsers with the option to calibrate these, access to the logging of that machine.
Connect Project Remotely
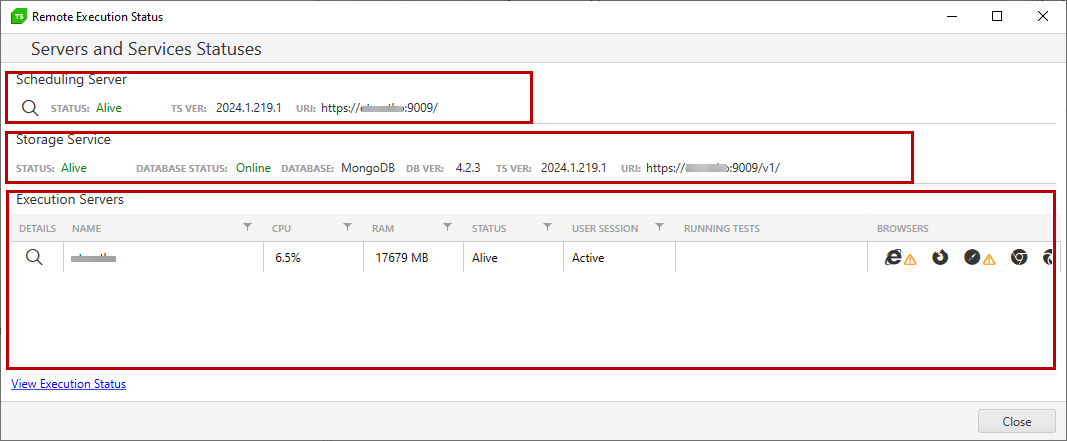
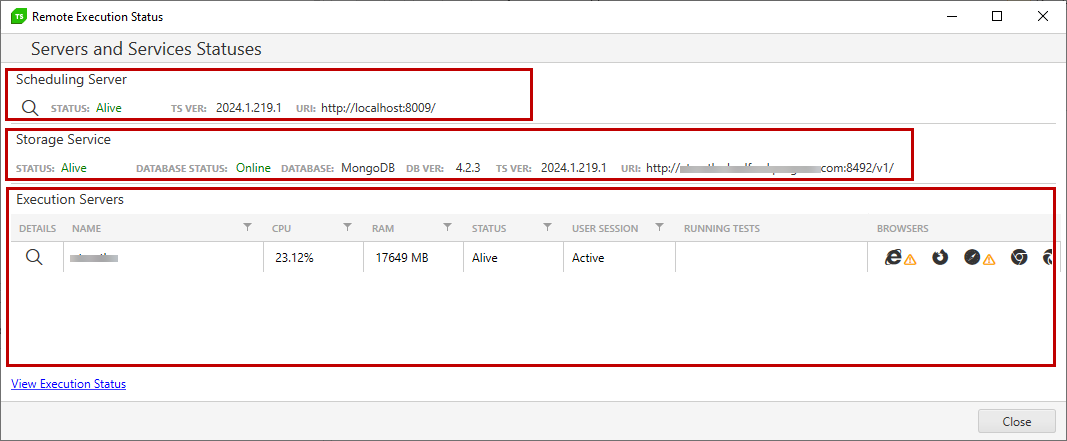
When current project is connected to schedule test lists remotely, the Remote Execution Status Window provides an overview for the Scheduling and Storage services and a list of all Execution Servers connected to this Scheduling Server.
- Test Studio Services Possible Statuses
- List of Execution Servers
- Execution Servers Details
- Execution Machine Possible Statuses
Test Studio Services Possible Statuses
Scheduling Server section shows if the service is running, which is the server URL and the version of Test Studio on that server machine.
Storage Server sections shows if the service is running, which is the server URL and the version of Test Studio on that server machine. Along with that is displayed the database version and if its service is running.
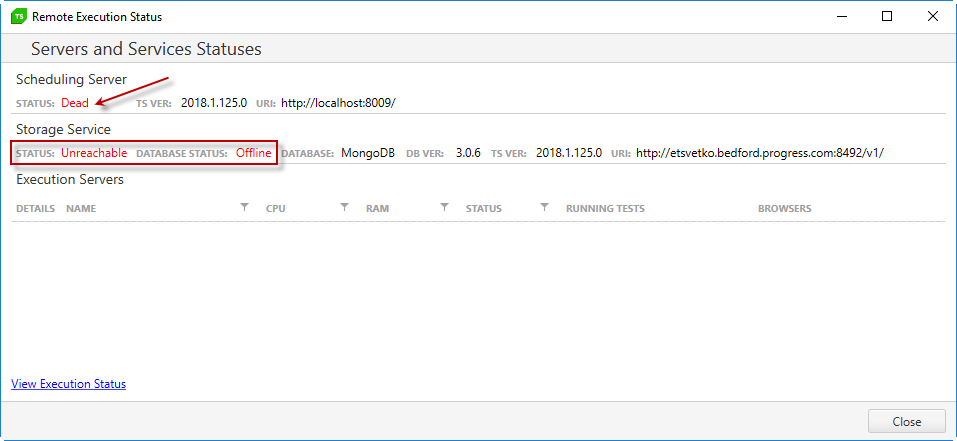
If any of the services is not running for some reason its status is highlighted in red to indicate that there is something wrong. If the Scheduling Service is down the Storage and Database are also down.
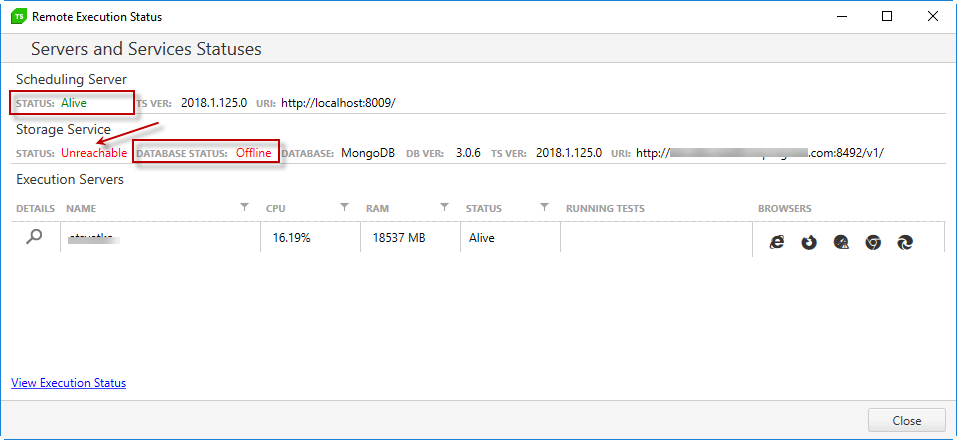
- If the Storage Service is down, the Scheduling service remains alive but the Database is not usable.
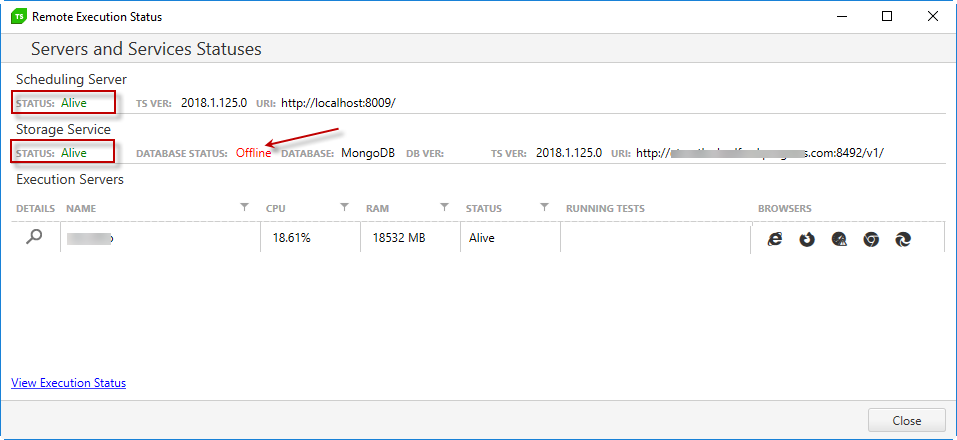
- If the MongoDB service or the database is down only its status is highlighted in red.
List of Execution Servers
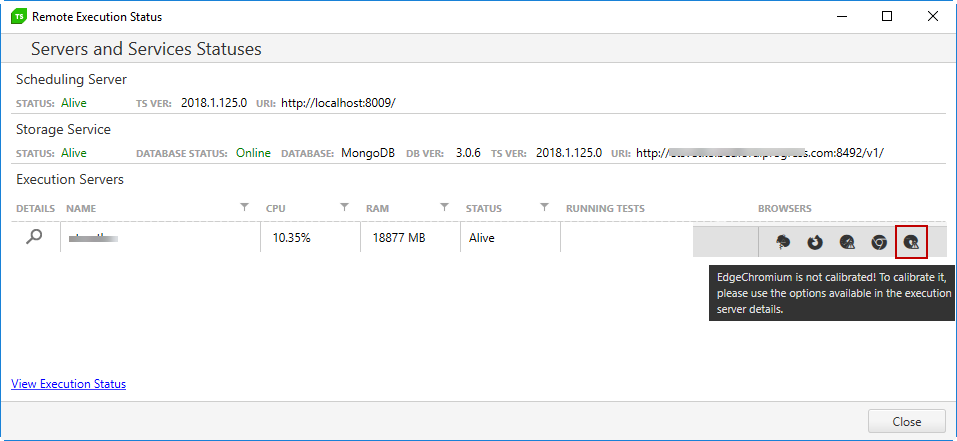
- If any of the available browsers on the remote machines are not calibrated, the respective browser icon will be marked with a yellow warning sign. Double click that machine to open its details and calibrate the browser.
Tip
To ensure executing browser is always calibrated you can use theAutoCalibrateBrowserstest list setting which is under the Web tab.
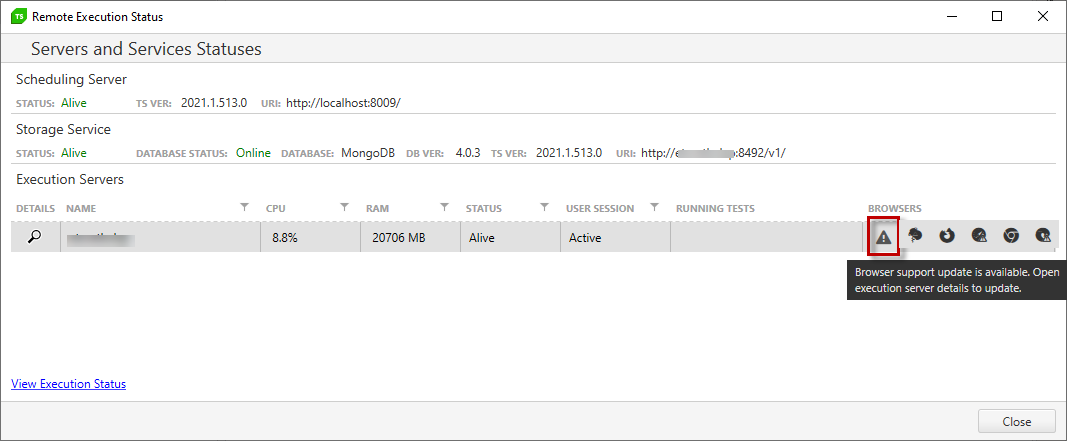
- When an update for the latest browser versions is available, a warning icon appears in front of the browsers' icons. To update Test Studio for the latest browsers on this execution server, open the machine details in the Execution status view and use the Update button.
Tip
The same Update button is also available in the Test Runner application on the remote machine. So, you can logon on the machine and open its Execution client and update the installation for latest browser support.
Execution Servers Details
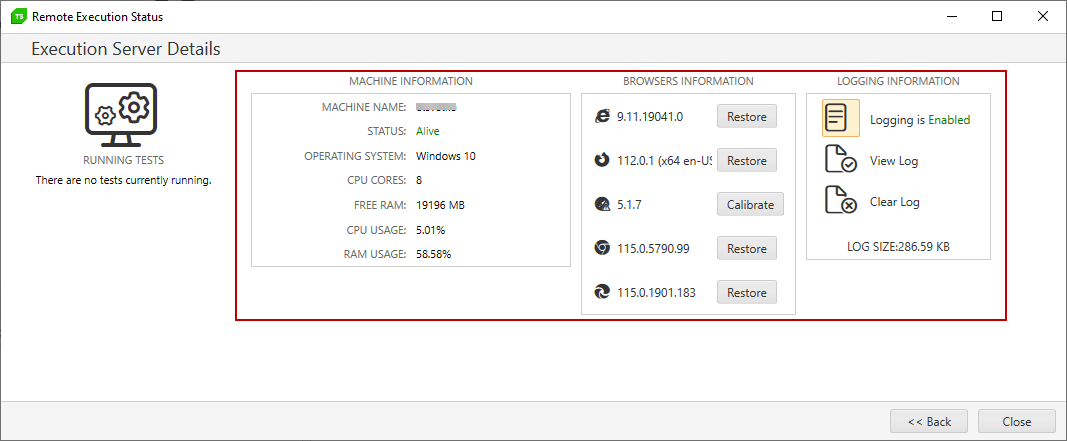
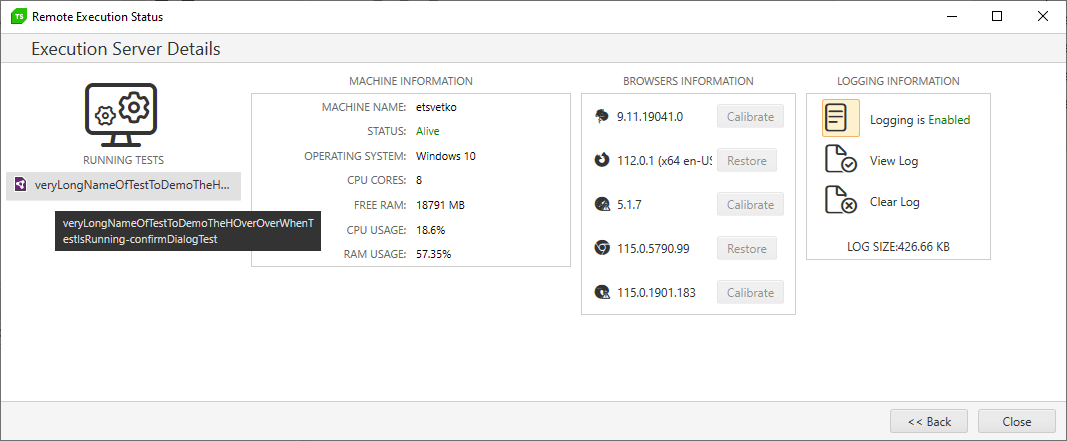
To view detailed information about an Execution Server, double-click the respective row in the grid or click the magnifier icon in front of the machine name. The Execution Server Details screen provides extended information about the specifications, system performance and test execution status of an Execution machine.
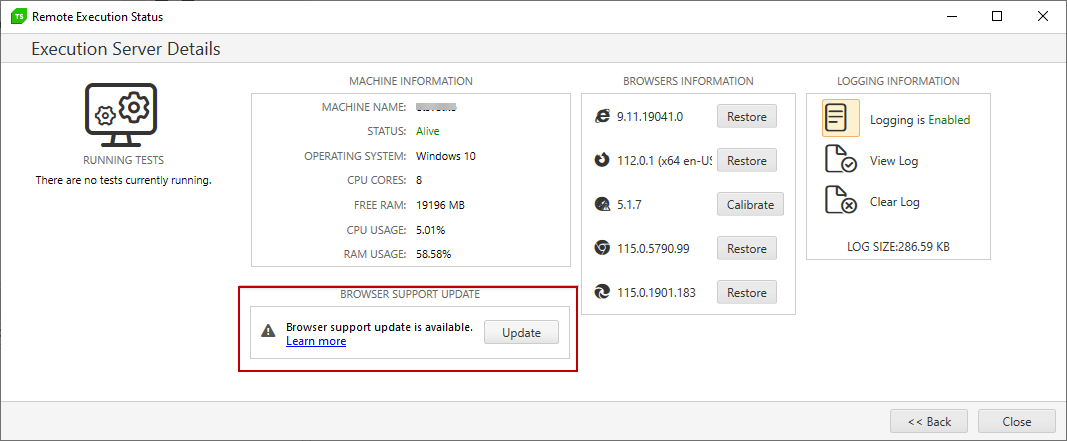
The Machine Information section displays system specification for the machine.
The Browser Support Update section notifies for the current state for browser support on the machine. If this needs to be updated, a warning sign notifies an update is available.
The Browser Information section displays all installed browsers on the execution machine along with their calibration state. All installed browsers on the remote machine could be calibrated or restored to default settings from the provided buttons - Calibrate and Restore.
The Logging information section allows you to enable or disable the Logging on the Execution machine, View and Clear the Log.
Execution Machine Possible Statuses
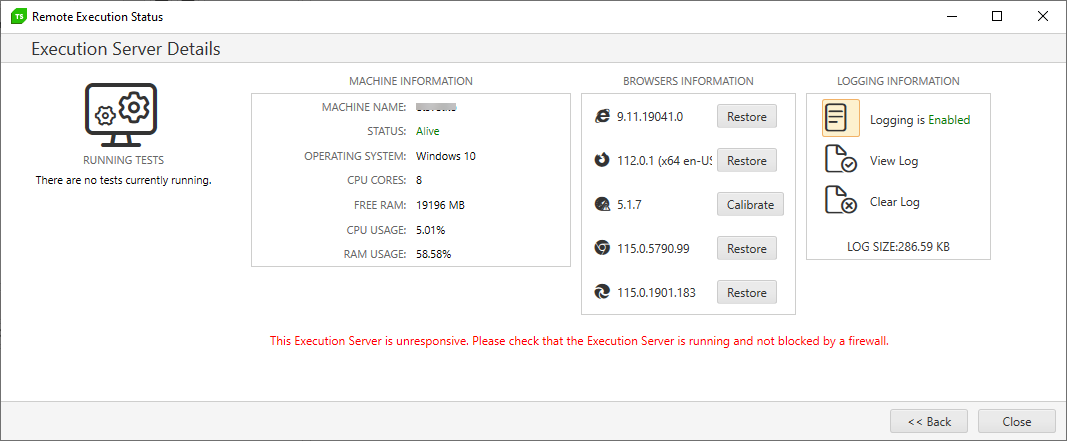
The Execution Server Details view displays different statuses for the selected execution machine as per its state
- If there are tests running on the machine only the buttons in the Logging sections will be enabled. The installed browsers could not be calibrated while tests are being executed.
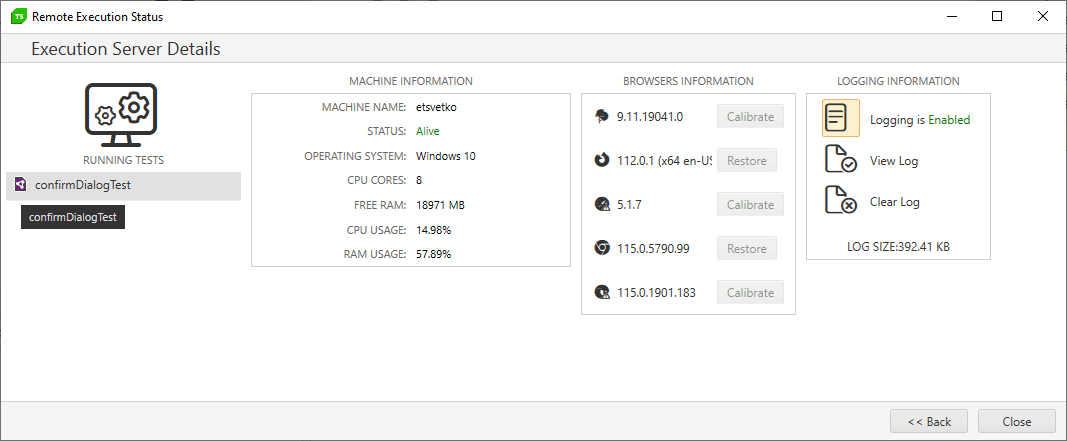
- If the name of the currently executed test on an execution machine is too long it will be partially displayed. To see the whole string hover the mouse over the partially displayed one.
- If the execution machine could not be accessed all buttons in the Browser and Logging sections will be disabled. A warning message appears to double check what could be preventing the connection to remote execution server.
The Back button navigates back to the list with connected execution machines.
Connect Project via Reverse Proxy (Advanced)
When current project is connected to schedule test lists remotely via Proxy Server, the Remote Execution Status Window provides an overview for the Scheduling and Storage services configured behind the proxy and a list of all Execution Servers connected to this Scheduling Server also hosted behind the proxy.