SurfaceSeries3D
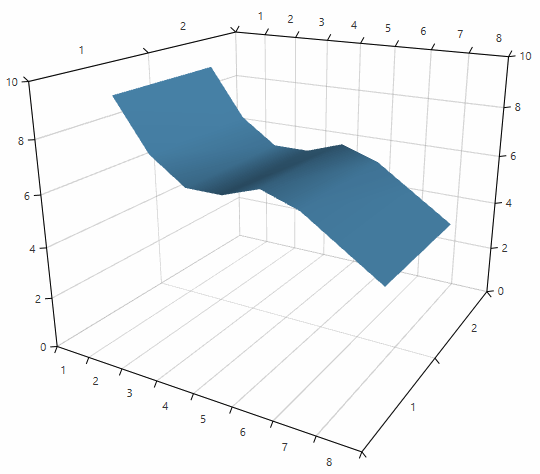
SurfaceSeries3D visualizes three-dimensional data represented by a surface. Each data point is defined by X, Z and Y values which determines its position in the plot area.
The algorithm that connects the SurfaceSeries3D points into a surface expects that the X and Y values of the plotted data will form a grid-like layout. Otherwise, there may be points that are not connected. If your data requires a different setup you can implement custom logic that connects the points and creates triangles as shown in the Customizing surface triangulation section of this article.
Declaratively defined series
You can use the code from Example 1 to create a SurfaceSeries3D.
Example 1: Defining series in XAML
<telerik:RadCartesianChart3D>
    <telerik:RadCartesianChart3D.XAxis>
        <telerik:CategoricalAxis3D/>
    </telerik:RadCartesianChart3D.XAxis>
    <telerik:RadCartesianChart3D.YAxis>
        <telerik:CategoricalAxis3D />
    </telerik:RadCartesianChart3D.YAxis>
    <telerik:RadCartesianChart3D.ZAxis>
        <telerik:LinearAxis3D />
    </telerik:RadCartesianChart3D.ZAxis>
    <telerik:RadCartesianChart3D.Series>
        <telerik:SurfaceSeries3D>
            <telerik:SurfaceSeries3D.DataPoints>
                <telerik:SurfaceDataPoint3D XValue="1" YValue="1" ZValue="9" />
                <telerik:SurfaceDataPoint3D XValue="2" YValue="1" ZValue="7" />
                <telerik:SurfaceDataPoint3D XValue="3" YValue="1" ZValue="6" />
                <telerik:SurfaceDataPoint3D XValue="4" YValue="1" ZValue="6" />
                <telerik:SurfaceDataPoint3D XValue="5" YValue="1" ZValue="6.5" />
                <telerik:SurfaceDataPoint3D XValue="6" YValue="1" ZValue="6" />
                <telerik:SurfaceDataPoint3D XValue="7" YValue="1" ZValue="5" />
                <telerik:SurfaceDataPoint3D XValue="8" YValue="1" ZValue="4" />
                <telerik:SurfaceDataPoint3D XValue="1" YValue="2" ZValue="9" />
                <telerik:SurfaceDataPoint3D XValue="2" YValue="2" ZValue="7" />
                <telerik:SurfaceDataPoint3D XValue="3" YValue="2" ZValue="6" />
                <telerik:SurfaceDataPoint3D XValue="4" YValue="2" ZValue="6" />
                <telerik:SurfaceDataPoint3D XValue="5" YValue="2" ZValue="6.5" />
                <telerik:SurfaceDataPoint3D XValue="6" YValue="2" ZValue="6" />
                <telerik:SurfaceDataPoint3D XValue="7" YValue="2" ZValue="5" />
                <telerik:SurfaceDataPoint3D XValue="8" YValue="2" ZValue="4" />
            </telerik:SurfaceSeries3D.DataPoints>
        </telerik:SurfaceSeries3D>
    </telerik:RadCartesianChart3D.Series>
    <telerik:RadCartesianChart3D.Grid>
        <telerik:CartesianChart3DGrid />
    </telerik:RadCartesianChart3D.Grid>
</telerik:RadCartesianChart3D>
Figure 1: SurfaceSeries3D
Data bound series
You can use the XValueBinding, YValueBinding and ZValueBinding properties of SurfaceSeries3D to bind the SurfaceDataPoint3D properties to the properties of the view models. The ItemsSource property is used to pass the data collection to the series.
Example 2: Defining a model for the data points and setting up the data context
public class PlotInfo
{
    public double XValue { get; set; }
    public double YValue { get; set; }
    public double ZValue { get; set; }
}

//.......
this.DataContext = new ObservableCollection<PlotInfo>
{
    new PlotInfo { XValue = 10, YValue = 20, ZValue = 150, },
    //....
};
Example 3: Setting up the series
<telerik:SurfaceSeries3D XValueBinding="XValue" YValueBinding="YValue" ZValueBinding=”ZValue” ItemsSource="{Binding}"/>
Colorizers
The SurfaceSeries3D colorizer determines the color appearance of the surface. The series supports two colorizers - SurfaceSeries3DValueGradientColorizer and SurfaceSeries3DValueGradientColorizer.
-
SurfaceSeries3DValueGradientColorizer
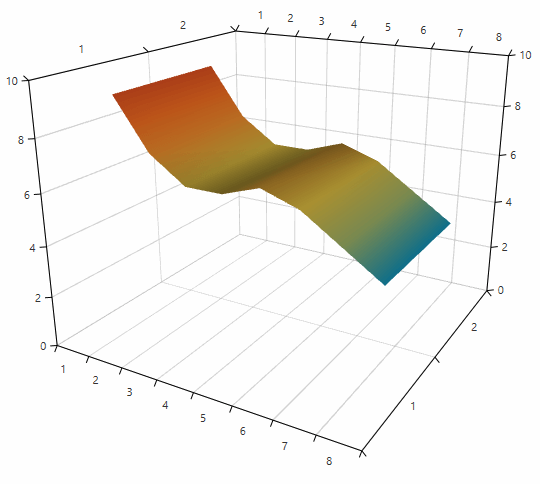
This colorizer uses a collection of GradientStop objects and creates a gradient texture based on the gradient stops colors and offsets. The texture is applied on the surface.
The colorizer works with relative offsets (between 0 and 1) by default. You can change this and work with absolute offsets by setting the IsAbsolute property to True.
Example 4: Setting the IsAbsolute property
<telerik:SurfaceSeries3DValueGradientColorizer IsAbsolute="True">The gradient stops are stored in the GradientStops collection.
Example 5: Setting the gradient stops
    <telerik:SurfaceSeries3D>
        <telerik:SurfaceSeries3D.Colorizer>
            <telerik:SurfaceSeries3DValueGradientColorizer IsAbsolute="True">
              <telerik:SurfaceSeries3DValueGradientColorizer.GradientStops>
                    <GradientStopCollection>
                        <GradientStop Color="#0D3C55" Offset="3" />
                        <GradientStop Color="#1395BA" Offset="4" />
                        <GradientStop Color="#A2B86C" Offset="5" />
                        <GradientStop Color="#EBC844" Offset="6" />
                        <GradientStop Color="#EF8B2C" Offset="7" />
                        <GradientStop Color="#F16C20" Offset="8" />
                        <GradientStop Color="#D94E1F" Offset="9" />
                        <GradientStop Color="#C02E1D" Offset="10" />
                    </GradientStopCollection>
                </telerik:SurfaceSeries3DValueGradientColorizer.GradientStops>
            </telerik:SurfaceSeries3DValueGradientColorizer>
        </telerik:SurfaceSeries3D.Colorizer>
    </telerik:SurfaceSeries3D>
Figure 2: SurfaceSeries3DValueGradientColorizer
-
SurfaceSeries3DDataPointColorizer
This colorizer uses colors obtained from the plotted data points and based on them creates a gradient texture which is applied on the surface. By default the SurfaceSeries3DDataPointColorizer works only in a data binding scenario. The colorizer requires each data point to define a color in its model. You can bind the color from the point's model to the colorizer via the ColorBinding property. The property expects a path to a property of type Color in the model of the data point.
The color of a point will be blend with the colors of its neighbour points, thus forming a gradient texture applied to the part of the surface that is formed between the points.
Examples 6, 7 and 8 demonstrate how to use the colorizer in a data binding scenario.
Example 6: Setting up the view
    <telerik:RadCartesianChart3D>
        <telerik:RadCartesianChart3D.XAxis>
            <telerik:CategoricalAxis3D/>
        </telerik:RadCartesianChart3D.XAxis>
        <telerik:RadCartesianChart3D.YAxis>
            <telerik:CategoricalAxis3D />
        </telerik:RadCartesianChart3D.YAxis>
        <telerik:RadCartesianChart3D.ZAxis>
            <telerik:LinearAxis3D />
        </telerik:RadCartesianChart3D.ZAxis>
        <telerik:RadCartesianChart3D.Series>
            <telerik:SurfaceSeries3D x:Name="surfaceSeries"
                                     XValueBinding="XValue"
                                     YValueBinding="YValue"
                                     ZValueBinding="ZValue"
                                     ItemsSource="{Binding}">
                <telerik:SurfaceSeries3D.Colorizer>
                    <telerik:SurfaceSeries3DDataPointColorizer ColorBinding="Color"/>
                </telerik:SurfaceSeries3D.Colorizer>
            </telerik:SurfaceSeries3D>
        </telerik:RadCartesianChart3D.Series>
        <telerik:RadCartesianChart3D.Grid>
            <telerik:CartesianChart3DGrid />
        </telerik:RadCartesianChart3D.Grid>
    </telerik:RadCartesianChart3D>
Example 7: Defining the view model of the data points
    public class PlotInfo
    {
        public string XValue { get; set; }
        public string YValue { get; set; }
        public double ZValue { get; set; }
        public Color Color { get; set; }
    }
Example 8: Setting up the DataContext
    var source = new ObservableCollection<PlotInfo>()
    {
        new PlotInfo() { XValue = "1", YValue = "1", ZValue = 9, Color = (Color)ColorConverter.ConvertFromString("#C02E1D") },
        new PlotInfo() { XValue = "2", YValue = "1", ZValue = 7, Color = (Color)ColorConverter.ConvertFromString("#D94E1F") },
        new PlotInfo() { XValue = "3", YValue = "1", ZValue = 6, Color = (Color)ColorConverter.ConvertFromString("#F16C20") },
        new PlotInfo() { XValue = "4", YValue = "1", ZValue = 5, Color = (Color)ColorConverter.ConvertFromString("#EF8B2C") },
        new PlotInfo() { XValue = "5", YValue = "1", ZValue = 6.5, Color = (Color)ColorConverter.ConvertFromString("#ECAA38") },
        new PlotInfo() { XValue = "6", YValue = "1", ZValue = 6, Color = (Color)ColorConverter.ConvertFromString("#FDB813") },
        new PlotInfo() { XValue = "7", YValue = "1", ZValue = 5, Color = (Color)ColorConverter.ConvertFromString("#EBC844") },
        new PlotInfo() { XValue = "8", YValue = "1", ZValue = 4, Color = (Color)ColorConverter.ConvertFromString("#EEF66C") },
        new PlotInfo() { XValue = "1", YValue = "2", ZValue = 9, Color = (Color)ColorConverter.ConvertFromString("#0D3C55") },
        new PlotInfo() { XValue = "2", YValue = "2", ZValue = 7, Color = (Color)ColorConverter.ConvertFromString("#0F5B78") },
        new PlotInfo() { XValue = "3", YValue = "2", ZValue = 6, Color = (Color)ColorConverter.ConvertFromString("#117899") },
        new PlotInfo() { XValue = "4", YValue = "2", ZValue = 5, Color = (Color)ColorConverter.ConvertFromString("#1395BA") },
        new PlotInfo() { XValue = "5", YValue = "2", ZValue = 6.5, Color = (Color)ColorConverter.ConvertFromString("#5CA793") },
        new PlotInfo() { XValue = "6", YValue = "2", ZValue = 6, Color = (Color)ColorConverter.ConvertFromString("#54A421") },
        new PlotInfo() { XValue = "7", YValue = "2", ZValue = 5, Color = (Color)ColorConverter.ConvertFromString("#A2B86C") },
        new PlotInfo() { XValue = "8", YValue = "2", ZValue = 4, Color = (Color)ColorConverter.ConvertFromString("#98DA6B") },
    };

    this.surfaceSeries.DataContext = source;
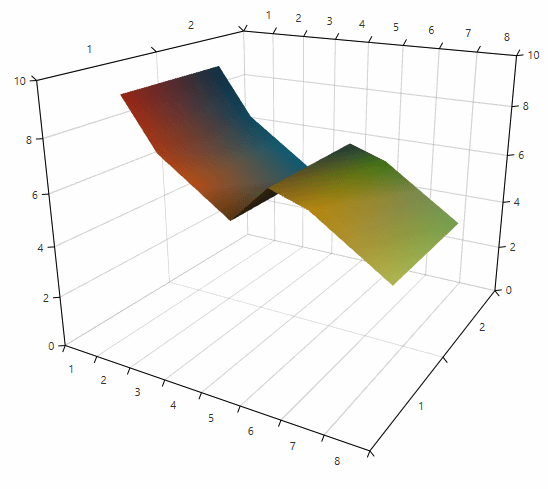
Figure 3: SurfaceSeries3DDataPointColorizer with default blending colorization mode
The SurfaceSeries3DDataPointColorizer supports two colorization modes which determine the appearance of the surface. You can change the mode via the ColorizationMode property of the colorizer. This property accepts the following values:
- Blend: The surface is divided into triangles determined by the original data points centers. The pixels in each triangle are color blends between the three colors determined by the data points (see Figure 3). This is the default colorization mode.
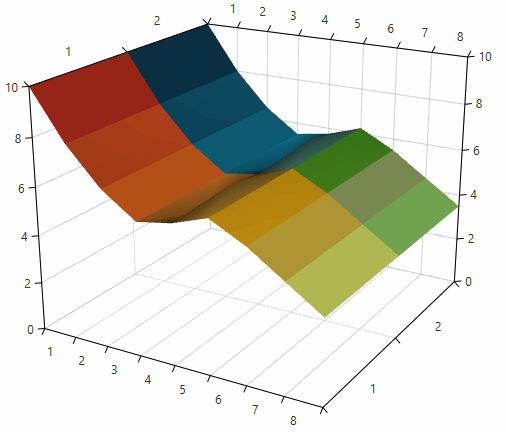
- Tiles: Each data point is presented by a tile with a solid color (see Figure 4).
Example 9: Setting colorization mode
<telerik:SurfaceSeries3DDataPointColorizer ColorizationMode="Tiles"/>Figure 4: SurfaceSeries3DDataPointColorizer with ColorizationMode set to Tiles
Display direction
The display direction specifies how the 3D points are connected, thus how the surface is displayed. The points are connected in a way to respect their 2D position on the plane which is perpendicular to the display direction. For example, if the display direction is the Z axis, then the points are connected so that their 2D position in the XY plane is respected.
Example 10: Setting display direction
<telerik:SurfaceSeries3D DisplayDirection="Z" />
Customizing surface triangulation
SurfaceSeries3D allows you define a custom collection of triangle indices used to create the triangles which form the surface. The indices collection will be set to the MeshGeometry3D object that presents the surface. To pass the custom triangulation you can use the TriangleIndices collection of SurfaceSeries3D. When the collection is null, the chart calculates the triangle indices automatically.
Example 11: Setting display direction
surfaceSeries.TriangleIndices = GetTriangleIndices();
//....
private Int32Collection GetTriangleIndices()
{
    //get the triangle indices
}
Customizing the data point visuals
By default the data points of the series are not visible and only the surface can be seen. You can display the data point visuals by setting the PointSize property.
Example 12: Setting point size in XAML
<telerik:SurfaceSeries3D PointSize="60 60 60">
Example 13: Setting point size in code
surfaceSeries.PointSize = new Size3D(60, 60, 60);
Figure 5: SurfaceSeries3D default point visuals
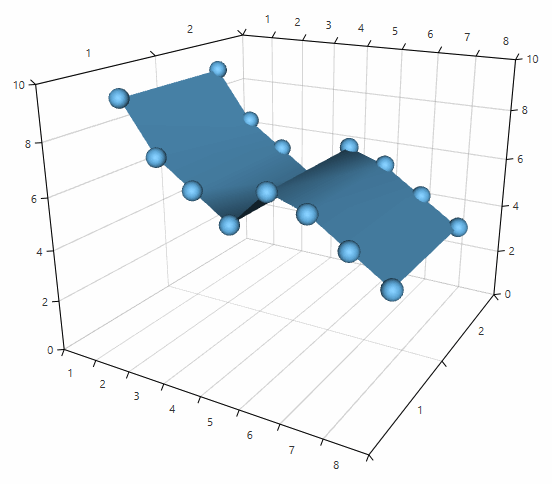
To customize the geometry and the material of the visual elements that represent the SurfaceSeries3D data points you can use the DefaultVisualMaterial and DefaultVisualGeometry properties of the series. Additionally, you can use the DefaultVisualMaterialSelector and DefaultVisualGeometrySelector to choose different materials and geometries based on a specific condition.
For more information, see the Customizing Cartesian Chart 3D Series help article.