Customizing Cartesian Chart 3D Series
The 3D series allows you to change the default appearance of their data point visuals. You can define a custom Material (texture) or a custom shape that is described by a MeshGeometry3D object.
You can find more information about 3D materials and geometries in the 3D Graphics Overview MSDN article.
Defining a custom material
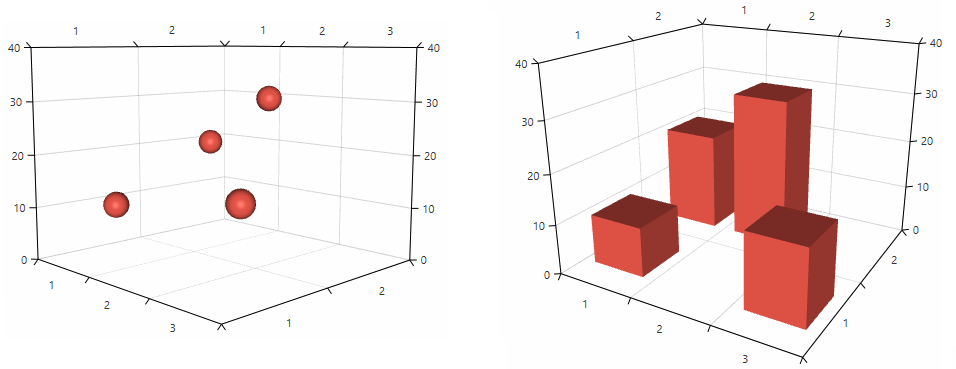
The material of a 3D object specifies the brush or the texture that will be applied to it. You can set the material of the series’ data points via the DefaultVisualMaterial property which is of type System.Windows.Media.Media3D.Material. You can use any of the material types provided by the WPF framework.
Example 1: Setting default visual material
<telerik:RadCartesianChart3D>
    <telerik:RadCartesianChart3D.Series>
        <telerik:BarSeries3D>
            <telerik:BarSeries3D.DefaultVisualMaterial>
                <MaterialGroup>
                    <DiffuseMaterial Brush="#DD5044"/>
                    <SpecularMaterial Brush="#BF444444" SpecularPower="30" />
                </MaterialGroup>
            </telerik:BarSeries3D.DefaultVisualMaterial>
        </telerik:BarSeries3D>
</telerik:RadCartesianChart3D>
Figure 1: BarSeries3D and PointSeries3D with custom material

Defining a custom geometry
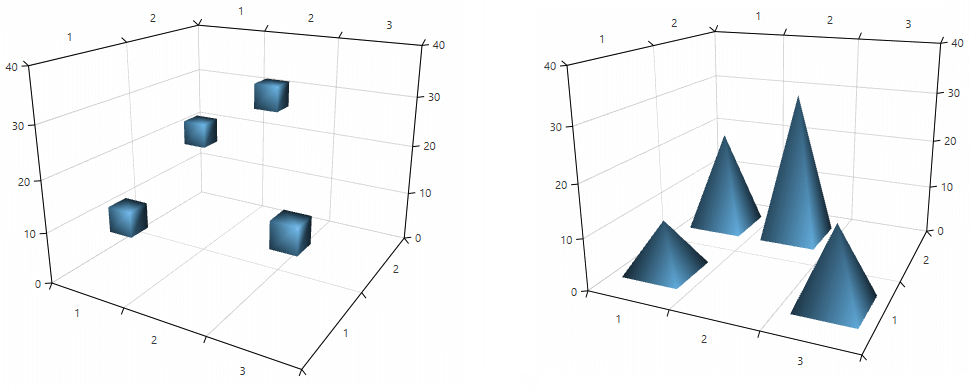
The geometry of a 3D object describes its shape. You can define a geometry for the series’ data points via the DefaultVisualGeometry property. The property is of type System.Windows.Media.Media3D.Geometry3D and accepts an object of type MeshGeometry3D.
Example 2: Defining a geometry presenting a cube and applying it to a PointSeries3D
<telerik:PointSeries3D>
    <telerik:PointSeries3D.DefaultVisualGeometry>
        <MeshGeometry3D Positions="0 0 0  0 0 1  0 1 1  0 1 0
                                   1 1 0  1 1 1  1 0 1  1 0 0"
                        TriangleIndices="0 1 2  0 2 3
                                         2 5 3  3 5 4
                                         4 5 7  7 5 6
                                         0 7 6  0 6 1
                                         0 3 7  3 4 7
                                         2 1 6  5 2 6"/>
    </telerik:PointSeries3D.DefaultVisualGeometry>
</telerik:PointSeries3D>
Example 3: Defining a geometry presenting a pyramid and applying it to a BarSeries3D
<telerik:BarSeries3D.DefaultVisualGeometry>
    <MeshGeometry3D Positions="0 0 0  0 1 0  1 1 0  1 0 0  0.5 0.5 1"
                    TriangleIndices="2 0 1  0 2 3
                                     2 1 4  0 4 1
                                     0 3 4  2 4 3"/>
</telerik:BarSeries3D.DefaultVisualGeometry>
The Positions are defined in relative units between 0 and 1, according to the bounds of the data point visual.
Figure 2: BarSeries3D and PointSeries3D with custom geometries

Geometry and material selectors
The chart allows you to choose different geometries and materials for each data point based on its model.
You can use the DefaultVisualMaterialSelector property to set a material selector and choose material dynamically.
Example 4: Implementing material selector
public class MyDefaultVisualMaterialSelector : MaterialSelector
{
    public Material MaterialA { get; set; }
    public Material MaterialB { get; set; }

    public override Material SelectMaterial(object context)
    {
        if (context is ModelA)
        {
            return this.MaterialA;
        }
        else if (context is ModelB)
        {
            return this.MaterialB;
        }
        else
        {
            return base.SelectMaterial(context);
        }
    }
}
Example 5: Defining material selector
<FrameworkElement.Resources>
    <local:MyDefaultVisualMaterialSelector x:Key="materialSelector">
        <local:MyDefaultVisualMaterialSelector.MaterialA>
            <DiffuseMaterial Brush="Green" />
        </local:MyDefaultVisualMaterialSelector.MaterialA>
        <local:MyDefaultVisualMaterialSelector.MaterialB>
            <DiffuseMaterial Brush="Orange" />
        </local:MyDefaultVisualMaterialSelector.MaterialB>
    </local:MyDefaultVisualMaterialSelector>
</FrameworkElement.Resources>
To improve the chart's performance, it is recommended to cache and reuse the Material objects instead of creating new ones for each model. You can find a runnable project demonstrating how to implement a material selector in our GitHub SDK repository. The project also demonstrates a simple material caching implementation.
You can use the DefaultVisualGeometrySelector property to choose different geometry for each data point dynamically.
Example 6: Implementing geometry selector
public class MyDefaultGeometry3DSelector : Geometry3DSelector
{
    public Material GeometryA { get; set; }
    public Material GeometryB { get; set; }

    public override Geometry3D SelectGeometry(object context)
    {
        if (context is ModelA)
        {
            return this.GeometryA;
        }
        else if (context is ModelB)
        {
            return this.GeometryB;
        }
        else
        {
            return base.SelectGeometry(context);
        }
    }
}
Example 7: Defining geometry selector
<FrameworkElement.Resources>
    <local:DefaultVisualGeometrySelector  x:Key="geometrySelector">
        <local:DefaultVisualGeometrySelector.GeometryA >
            <!--Set up the geometry-->
            <MeshGeometry3D />
        </local:DefaultVisualGeometrySelector.GeometryA>
        <local:DefaultVisualGeometrySelector.GeometryA >
            <!--Set up the geometry-->
            <MeshGeometry3D />
        </local:DefaultVisualGeometrySelector.GeometryA>
    </local:DefaultVisualGeometrySelector>
</FrameworkElement.Resources>