BarSeries3D
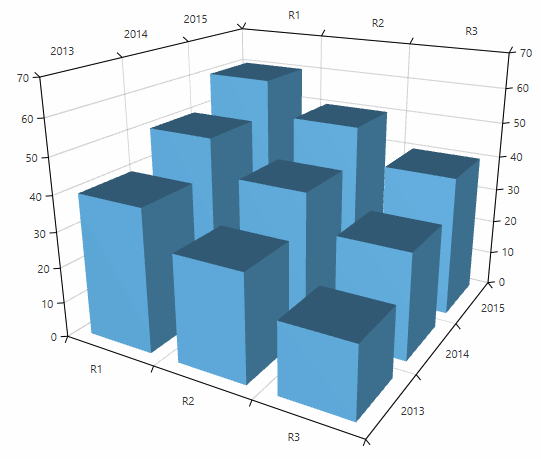
The bar series visualizes three dimensional data represented by 3D bars. Each data point defines a bar that is constructed by X, Z and Y values determining its position in the plot area.
Declaratively defined series
You can use the code from Example 1 to create a BarSeries3D.
Example 1: Defining series in XAML
<telerik:RadCartesianChart3D>
    <telerik:RadCartesianChart3D.XAxis>
        <telerik:CategoricalAxis3D />
    </telerik:RadCartesianChart3D.XAxis>
    <telerik:RadCartesianChart3D.YAxis>
        <telerik:CategoricalAxis3D />
    </telerik:RadCartesianChart3D.YAxis>
    <telerik:RadCartesianChart3D.ZAxis>
        <telerik:LinearAxis3D />
    </telerik:RadCartesianChart3D.ZAxis>
    <telerik:RadCartesianChart3D.Series>
        <telerik:BarSeries3D>
            <telerik:BarSeries3D.DataPoints>
                <telerik:XyzDataPoint3D XValue="R1" YValue="2013" ZValue="40" />
                <telerik:XyzDataPoint3D XValue="R1" YValue="2014" ZValue="50" />
                <telerik:XyzDataPoint3D XValue="R1" YValue="2015" ZValue="60" />
                <telerik:XyzDataPoint3D XValue="R2" YValue="2013" ZValue="30" />
                <telerik:XyzDataPoint3D XValue="R2" YValue="2014" ZValue="40" />
                <telerik:XyzDataPoint3D XValue="R2" YValue="2015" ZValue="50" />
                <telerik:XyzDataPoint3D XValue="R3" YValue="2013" ZValue="20" />
                <telerik:XyzDataPoint3D XValue="R3" YValue="2014" ZValue="30" />
                <telerik:XyzDataPoint3D XValue="R3" YValue="2015" ZValue="40" />
            </telerik:BarSeries3D.DataPoints>
        </telerik:BarSeries3D>
    </telerik:RadCartesianChart3D.Series>
    <telerik:RadCartesianChart3D.Grid>
        <telerik:CartesianChart3DGrid />
    </telerik:RadCartesianChart3D.Grid>
</telerik:RadCartesianChart3D>
Figure 1: BarSeries3D
Data bound series
You can use the XValueBinding, YValueBinding and ZValueBinding properties of BarSeries3D to bind the XyzDataPoints’ properties to the properties of the view models. The ItemsSource property is used to pass the data collection to the series.
Example 2: Defining a model for the data points and setting up the data context
public class PlotInfo
{
    public double XValue { get; set; }
    public double YValue { get; set; }
    public double ZValue { get; set; }
}

//.......
this.DataContext = new ObservableCollection<PlotInfo>
{
    new PlotInfo { XValue = 10, YValue = 20, ZValue = 150, },
    //....
};
Example 3: Setting up the series
<telerik:BarSeries3D XValueBinding="XValue" YValueBinding="YValue" ZValueBinding=”ZValue” ItemsSource="{Binding}"/>
Display direction
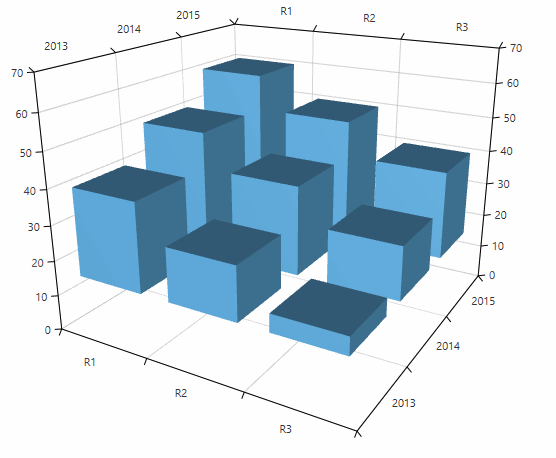
The display direction of the series specifies which axis determines the start (origin) and end of the bars. The bar is drawn from the origin value to the value of the bar on the corresponding axis (the display direction). The direction is defined via the DisplayDirection property which is of type Axis3DType? and it accepts the following values – X, Y and Z. The default display direction of BarSeries3D is Z.
You can use the OriginValue property to define the origin of the bars on the corresponding axis determined by the DisplayDirection property. The default origin value is 0.
Example 4: Setting the origin value
<telerik:BarSeries3D OriginValue="15">
Figure 2: Origin value
Customizing the data point visuals
The visual elements that present the BarSeries3D data points can be customized through the DefaultVisualMaterial and DefaultVisualGeometry properties of the series. Additionally, you can use the DefaultVisualMaterialSelector and DefaultVisualGeometrySelector to choose different materials and geometries based on a specific condition.
For more information, see the Customizing Cartesian Chart 3D Series help article.