LineSeries3D
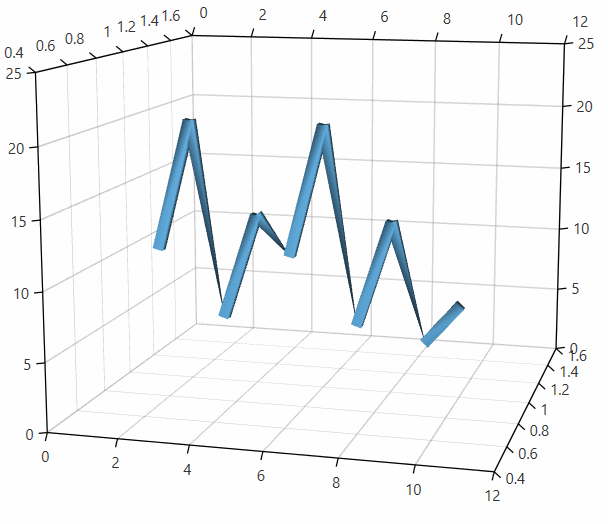
The line series visualizes three dimensional data represented by a line shape. Each data point is defined by X, Z and Y values which determines its position in the plot area.
Declaratively defined series
You can use the code from Example 1 to create a LineSeries3D.
Example 1: Defining series in XAML
<telerik:RadCartesianChart3D>
    <telerik:RadCartesianChart3D.XAxis>
        <telerik:LinearAxis3D/>
    </telerik:RadCartesianChart3D.XAxis>
    <telerik:RadCartesianChart3D.ZAxis>
        <telerik:LinearAxis3D/>
    </telerik:RadCartesianChart3D.ZAxis>
    <telerik:RadCartesianChart3D.YAxis>
        <telerik:LinearAxis3D/>
    </telerik:RadCartesianChart3D.YAxis>
    <telerik:RadCartesianChart3D.Series>
        <telerik:LineSeries3D>
            <telerik:LineSeries3D.DataPoints>
                <telerik:XyzDataPoint3D XValue="1" YValue="1" ZValue="10" />
                <telerik:XyzDataPoint3D XValue="2" YValue="1" ZValue="20" />
                <telerik:XyzDataPoint3D XValue="3" YValue="1" ZValue="5" />
                <telerik:XyzDataPoint3D XValue="4" YValue="1" ZValue="13" />
                <telerik:XyzDataPoint3D XValue="5" YValue="1" ZValue="10" />
                <telerik:XyzDataPoint3D XValue="6" YValue="1" ZValue="20" />
                <telerik:XyzDataPoint3D XValue="7" YValue="1" ZValue="5" />
                <telerik:XyzDataPoint3D XValue="8" YValue="1" ZValue="13" />
                <telerik:XyzDataPoint3D XValue="9" YValue="1" ZValue="4" />
                <telerik:XyzDataPoint3D XValue="10" YValue="1" ZValue="7" />
            </telerik:LineSeries3D.DataPoints>
        </telerik:LineSeries3D>
    </telerik:RadCartesianChart3D.Series>
    <telerik:RadCartesianChart3D.Grid>
        <telerik:CartesianChart3DGrid />
    </telerik:RadCartesianChart3D.Grid>
    <telerik:RadCartesianChart3D.Behaviors>
        <telerik:Chart3DCameraBehavior />
    </telerik:RadCartesianChart3D.Behaviors>
</telerik:RadCartesianChart3D>
Figure 1: LineSeries3D
Data bound series
Example 2: Defining a model for the data points and setting up the data context
public class PlotInfo
{
    public double XValue { get; set; }
    public double YValue { get; set; }
    public double ZValue { get; set; }
}

//.......
this.DataContext = new ObservableCollection<PlotInfo>
{
    new PlotInfo { XValue = 10, YValue = 20, ZValue = 150, },
    //....
};
Example 3: Setting up the series
<telerik:LineSeries3D XValueBinding="XValue" YValueBinding="YValue" ZValueBinding=”ZValue” ItemsSource="{Binding}"/>
Showing point visuals
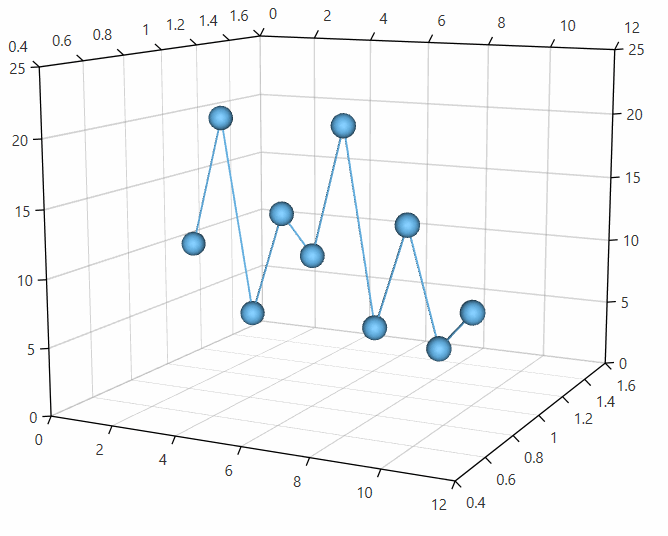
The line series supports visual elements for its data points. They are disabled by default.
To show the data point visual, set the PointSize property of the series.
Example 4: Setting point size in XAML
<telerik:LineSeries3D PointSize="60 60 60">
Example 5: Setting point size in code
lineSeries.PointSize = new Size3D(60, 60, 60);
Figure 2: Point visuals shown
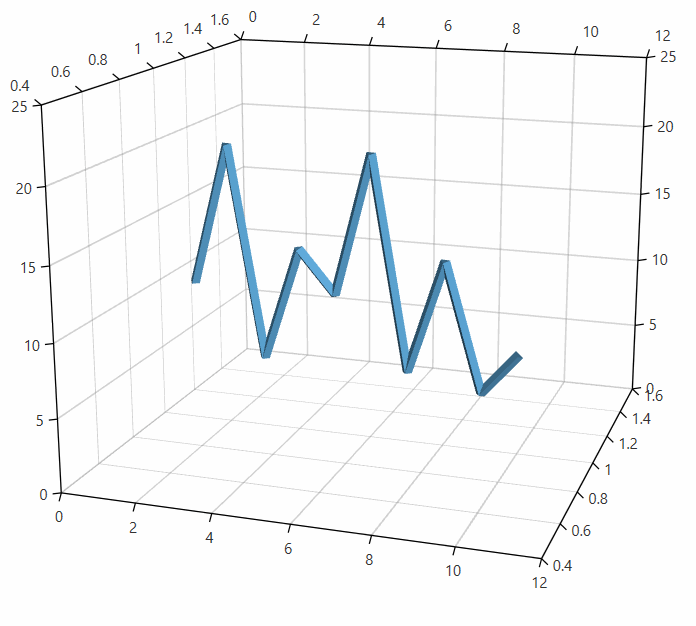
Setting the line size
You can change the line size by setting the DefaultLineVisualDiameter property of the series.
Example 6: Setting the line diameter
<telerik:LineSeries3D DefaultLineVisualDiameter="25">
Figure 3: Line diameter set to 25
Customizing the data point visuals
The visual elements that represent the LineSeries3D data points can be customized through the DefaultVisualMaterial and DefaultVisualGeometry properties of the series. Additionally, you can use the DefaultVisualMaterialSelector and DefaultVisualGeometrySelector to choose different materials and geometries based on a specific condition.
For more information, see the Customizing Cartesian Chart 3D Series help article.
Customizing the line visuals
The visual elements that represent the LineSeries3D's line can be customized through the DefaultLineVisualMaterial and DefaultLineVisualGeometry properties of the series. Additionally, you can use the DefaultLineVisualMaterialSelector and DefaultLineVisualGeometrySelector to choose different materials and geometries based on a specific condition.
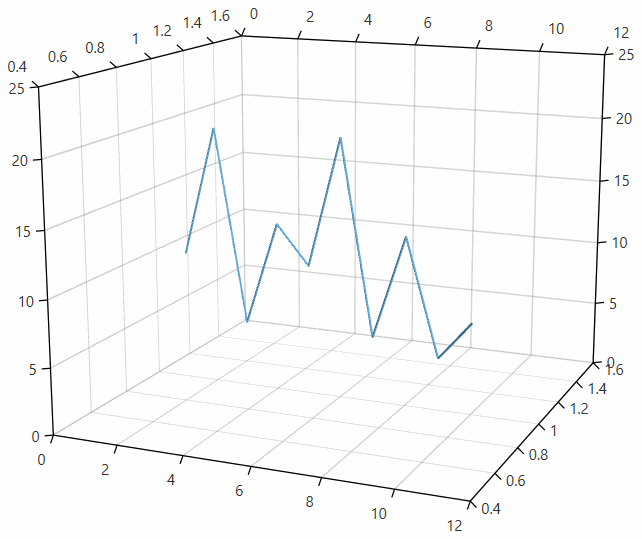
By default the series will be drawn with a single 3D polyline element. If the plotted data contains null values, the corresponding data point won't be drawn - a gap will appear. In this case a new polyline visual will be rendered for each null value that cuts the line. Setting the DefaulLineVisualGeometry or the DefaulLineVisualGeometry will trigger an alternative rendering approach where a visual element for each line segment between two data points will be created.
-
Setting the line's color
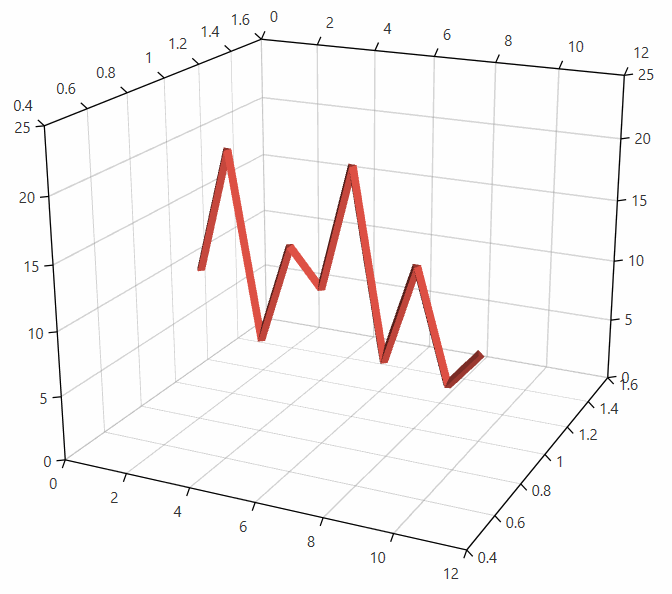
To change the color of the line you can use the DefaultLineVisualMaterial property of the series.
Example 7: Setting default line visual material
    <telerik:RadCartesianChart3D>
        <telerik:RadCartesianChart3D.Series>
            <telerik:LineSeries3D>
              <telerik:LineSeries3D.DefaultLineVisualMaterial>
                    <MaterialGroup>
                        <DiffuseMaterial Brush="#DD5044"/>
                        <SpecularMaterial Brush="#BF444444" SpecularPower="30" />
                    </MaterialGroup>
                </telerik:LineSeries3D.DefaultLineVisualMaterial>
            </telerik:LineSeries3D>
    </telerik:RadCartesianChart3D>
Figure 4: Custom line visual material
-
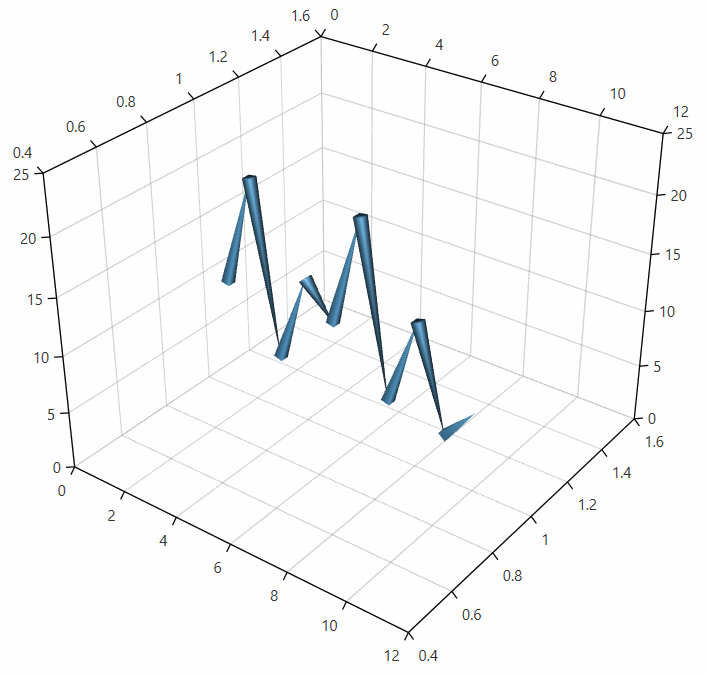
Setting the geometry of the line segments
To change the geometry of the line segments you can use the DefaultLineVisualGeometry property of the series.
Example 8: Setting default line visual geometry
    <telerik:RadCartesianChart3D>
        <telerik:RadCartesianChart3D.Series>
            <telerik:LineSeries3D>
                <telerik:LineSeries3D.DefaultLineVisualGeometry>
                    <MeshGeometry3D Positions="-0.5 -0.5 0  -0.5 0.5 0
                                                0.5 0.5 0  0.5 -0.5 0
                                                0 0 1"
                                    TriangleIndices="2 0 1  0 2 3
                                                     2 1 4  0 4 1
                                                     0 3 4  2 4 3"/>
                </telerik:LineSeries3D.DefaultLineVisualGeometry>
            </telerik:LineSeries3D>
    </telerik:RadCartesianChart3D>
Figure 5: Custom line visual geometry
-
Select a color using the material selector
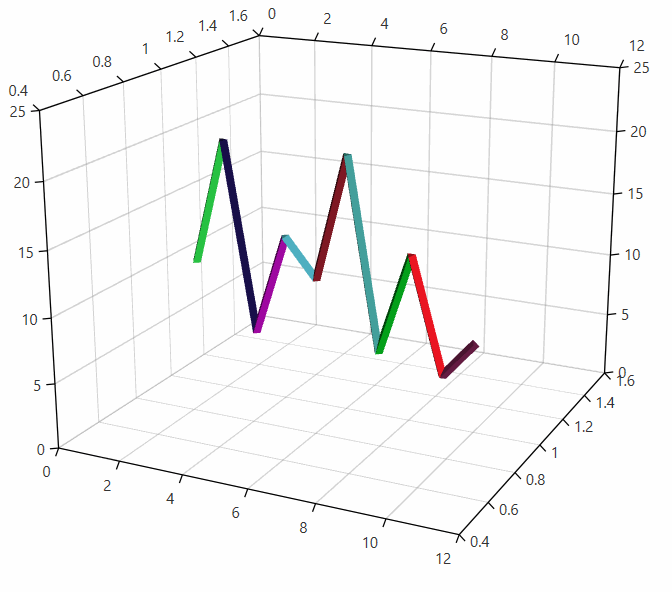
To change the material of the different line segments you can use the DefaultLineVisualMaterialSelector property of the series.
Example 9: Implementing a material selector
    public class LineMaterialSelector : MaterialSelector
    {
        private static Random randomNumberGenerator = new Random();
        public override Material SelectMaterial(object context)
        {
            Brush brush = GetRandomBrush();
            return new DiffuseMaterial(brush);
        }

        private static Brush GetRandomBrush()
        {
            byte red = (byte)randomNumberGenerator.Next(1, 255);
            byte green = (byte)randomNumberGenerator.Next(1, 255);
            byte blue = (byte)randomNumberGenerator.Next(1, 255);
            return new SolidColorBrush(Color.FromRgb(red, green, blue));
        }
    }
Example 10: Setting default line visual material selector
    <telerik:RadCartesianChart3D>
        <telerik:RadCartesianChart3D.Series>
            <telerik:LineSeries3D>
                <telerik:LineSeries3D.DefaultLineVisualMaterialSelector>
                    <local:LineMaterialSelector />
                </telerik:LineSeries3D.DefaultLineVisualMaterialSelector>
            </telerik:LineSeries3D>
    </telerik:RadCartesianChart3D>
Figure 6: Line with random colors
-
Select a geometry using the geometry selector
To change the geometry of the different line segments you can use the DefaultLineVisualGeometrySelector property of the series.
Example 11: Implementing a geometry selector
    public class LineGeometrySelector : Geometry3DSelector
    {
        public Geometry3D Geometry1 { get; set; }
        public Geometry3D Geometry2 { get; set; }

        int count = 0;
        public override Geometry3D SelectGeometry(object context)
        {
            count++;
            if (count % 2 == 0)
            {
                return this.Geometry1;
            }
            return this.Geometry2;
        }
    }
Example 12: Setting default line visual geometry selector
    <telerik:RadCartesianChart3D>
        <telerik:RadCartesianChart3D.Series>
            <telerik:LineSeries3D>
             <telerik:LineSeries3D.DefaultLineVisualGeometrySelector>
                    <local:LineGeometrySelector>
                        <local:LineGeometrySelector.Geometry1>
                            <MeshGeometry3D Positions="-0.5 -0.5 0  -0.5 0.5 0
                                                        0.5 0.5 0  0.5 -0.5 0
                                                        0 0 1"
                                            TriangleIndices="2 0 1  0 2 3
                                                             2 1 4  0 4 1
                                                             0 3 4  2 4 3"/>
                        </local:LineGeometrySelector.Geometry1>
                        <local:LineGeometrySelector.Geometry2>
                            <MeshGeometry3D Positions="-0.5 -0.5 0  -0.5 -0.5 1  -0.5 0.5 1  -0.5 0.5 0
                                                       0.5 0.5 0  0.5 0.5 1  0.5 -0.5 1  0.5 -0.5 0"
                                            TriangleIndices="0 1 2  0 2 3
                                                            2 5 3  3 5 4
                                                            4 5 7  7 5 6
                                                            0 7 6  0 6 1
                                                            0 3 7  3 4 7
                                                            2 1 6  5 2 6"/>
                        </local:LineGeometrySelector.Geometry2>
                    </local:LineGeometrySelector>
                </telerik:LineSeries3D.DefaultLineVisualGeometrySelector>
            </telerik:LineSeries3D>
    </telerik:RadCartesianChart3D>
Figure 7: Line with random colors