WPF ChartView3D Overview
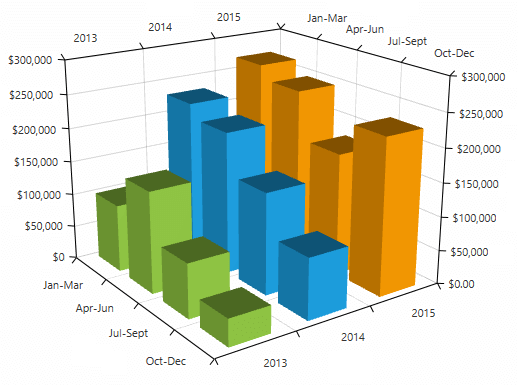
RadChartView3D provides you with a charting component that enables three-dimensional data visualization in the 3D space. Thus allowing the end user to analyze complex data. RadChartView3D is presented by the RadCartesianChart3D control.
The RadChartView3D is part of Telerik UI for WPF, a
professional grade UI library with 160+ components for building modern and feature-rich applications. To try it out sign up for a free 30-day trial.
![]()
Key Features
Visualizing 3D data: You can get started with RadCartesianChart3D in the Getting Started article.
Camera behavior: The chart allows you to control the camera position from where the scene is observed. You can rotate the camera around the chart and change its distance. For more information, see the Camera Behavior article.
Series: There are several different visualiztions available via the chart series - bar, surface, etc. For more information, see the Series section in the help documentation.
Axes: RadChartView3D have few axis types which you can use to display different type of data - numeric and categorical. For more information, see the Axes help article.
You can find examples that demonstrate RadChartView3D in our demo application.
Telerik UI for WPF Support and Learning Resources
- Telerik UI for WPF 3DChart Homepage
- Get Started with the Telerik UI for WPF 3DChart
- Telerik UI for WPF API Reference
- Getting Started with Telerik UI for WPF Components
- Telerik UI for WPF Virtual Classroom (Training Courses for Registered Users)
- Telerik UI for WPF 3DChart Forums
- Telerik UI for WPF Knowledge Base