PointSeries3D
The point series visualizes three dimensional data represented by ellipsoid shapes (spheres by default). Each data point is defined by X, Z and Y values which determines its position in the plot area. The size of the shapes is defined via the PointSize property of the series.
Declaratively defined series
You can use the code from Example 1 to create a PointSeries3D.
Example 1: Defining series in XAML
<telerik:RadCartesianChart3D>
<telerik:RadCartesianChart3D.XAxis>
<telerik:CategoricalAxis3D />
</telerik:RadCartesianChart3D.XAxis>
<telerik:RadCartesianChart3D.YAxis>
<telerik:CategoricalAxis3D />
</telerik:RadCartesianChart3D.YAxis>
<telerik:RadCartesianChart3D.ZAxis>
<telerik:LinearAxis3D />
</telerik:RadCartesianChart3D.ZAxis>
<telerik:RadCartesianChart3D.Series>
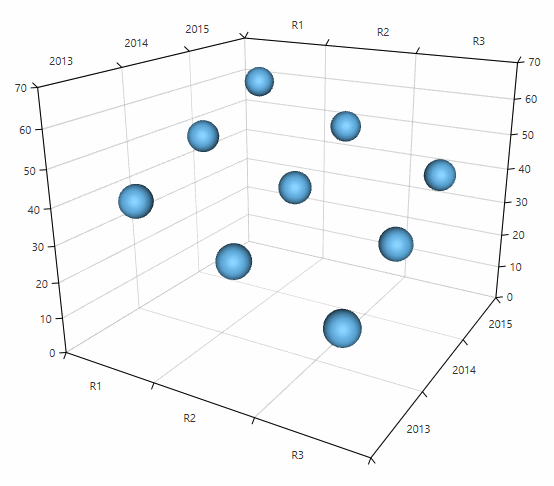
<telerik:PointSeries3D PointSize="100 100 100">
<telerik:PointSeries3D.DataPoints>
<telerik:XyzDataPoint3D XValue="R1" YValue="2013" ZValue="40" />
<telerik:XyzDataPoint3D XValue="R1" YValue="2014" ZValue="50" />
<telerik:XyzDataPoint3D XValue="R1" YValue="2015" ZValue="60" />
<telerik:XyzDataPoint3D XValue="R2" YValue="2013" ZValue="30" />
<telerik:XyzDataPoint3D XValue="R2" YValue="2014" ZValue="40" />
<telerik:XyzDataPoint3D XValue="R2" YValue="2015" ZValue="50" />
<telerik:XyzDataPoint3D XValue="R3" YValue="2013" ZValue="20" />
<telerik:XyzDataPoint3D XValue="R3" YValue="2014" ZValue="30" />
<telerik:XyzDataPoint3D XValue="R3" YValue="2015" ZValue="40" />
</telerik:PointSeries3D.DataPoints>
</telerik:PointSeries3D>
</telerik:RadCartesianChart3D.Series>
<telerik:RadCartesianChart3D.Grid>
<telerik:CartesianChart3DGrid />
</telerik:RadCartesianChart3D.Grid>
</telerik:RadCartesianChart3D>
Figure 1: PointSeries3D
Data bound series
You can use the XValueBinding, YValueBinding and ZValueBinding properties of PointSeries3D to bind the XyzDataPoints’ properties to the properties of the view models. The ItemsSource property is used to pass the data collection to the series.
Example 2: Defining a model for the data points and setting up the data context
public class PlotInfo
{
    public double XValue { get; set; }
    public double YValue { get; set; }
    public double ZValue { get; set; }
}

//.......
this.DataContext = new ObservableCollection<PlotInfo>
{
    new PlotInfo { XValue = 10, YValue = 20, ZValue = 150, },
    //....
};
Example 3: Setting up the series
<telerik:PointSeries3D XValueBinding="XValue" YValueBinding="YValue" ZValueBinding=”ZValue” ItemsSource="{Binding}"/>
Customizing the data point visuals
You can change the size of the data points using the PointSize property.
Example 4: Setting point size in XAML
<telerik:PointSeries3D PointSize="60 60 60">
Example 5: Setting point size in code
pointSeries.PointSize = new Size3D(60, 60, 60);
For more information, see the Customizing Cartesian Chart 3D Series help article.