Step Area Series
The StepAreaSeries is similar to the StepLine Series. The difference is that the StepAreaSeries fills the area between the line segments and the categorical axis.
Properties
StepAreaSeries class inherits from the AreaSeries class - See the inherited properties.
-
RisersPosition: Gets or sets the RisersPosition that will be used to draw the series.
- Default: Risers' position depends on the axis' plot mode.
- OnTicks: Risers will be positioned where the ticks of the axis are positioned.
- BetweenTicks: Risers will be positioned between the ticks of the axis.
Example
Example 1 shows how to create a RadCartesianChart with a StepAreaSeries.
Example 1: Defining the RadCartesianChart and StepAreaSeries
<Grid xmlns:telerikChart="using:Telerik.UI.Xaml.Controls.Chart"
xmlns:telerikCharting="using:Telerik.Charting">
<telerikChart:RadCartesianChart>
<telerikChart:RadCartesianChart.HorizontalAxis>
<telerikChart:CategoricalAxis/>
</telerikChart:RadCartesianChart.HorizontalAxis>
<telerikChart:RadCartesianChart.VerticalAxis>
<telerikChart:LinearAxis/>
</telerikChart:RadCartesianChart.VerticalAxis>
<telerikChart:StepAreaSeries>
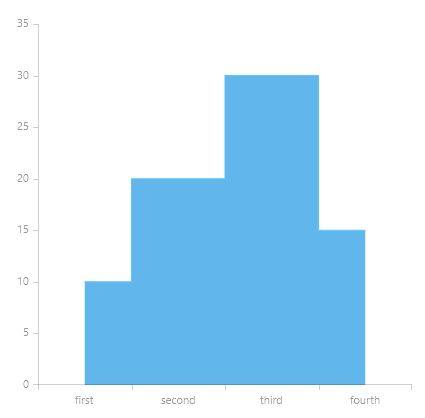
<telerikCharting:CategoricalDataPoint Category="first" Value="10"/>
<telerikCharting:CategoricalDataPoint Category="second" Value="20"/>
<telerikCharting:CategoricalDataPoint Category="third" Value="30"/>
<telerikCharting:CategoricalDataPoint Category="fourth" Value="15"/>
</telerikChart:StepAreaSeries>
</telerikChart:RadCartesianChart>
</Grid>
Figure 1: Result from Example 1